Sources & methods

Every number, in context.

Twenty-one source groups. Different populations, periods and questions. A guide to what the evidence can—and cannot—tell us.

Updated . Stanford AI100 adds infrastructure context; older MGI skills evidence and Dubai Future Foundation creative-industry consultation add distinct supporting perspectives. All 335 core observations and 16 separate science workflow observations retain their values and periods.

Full evidence library: tables, reports, downloads and methods →

01 / The research

Start with the question each source answers.

Microsoft AI Economy Institute

Where is generative AI used? Estimated user shares across 147 economies, H1 2025–Q2 2026, for people aged 15–64. Separate US estimates cover Q1 2026.

Adjusted telemetry and modelled local estimates measure use, not proficiency or productivity; global and US methods differ.

Anthropic

What happens inside AI conversations? Claude chat and Cowork geography and purpose: May 2026. Output analysis: 10 April–10 June 2026.

Classified conversations from one provider are not population adoption; the country index compares conversation share with working-age population share.

European Commission JRC / Eurostat

Which businesses use AI? EU enterprises with 10+ persons employed, 2021–2025; dataset snapshot updated 15 June 2026. JRC adds strategic-sector analysis.

Broad AI includes more than generative AI. Finance and several public services are excluded; strategic-sector coverage varies substantially.

McKinsey

How far has organisational deployment progressed? 1,719 respondents in 97 nations; fieldwork 4 May–8 June 2026, weighted by national GDP.

A self-report survey, not a firm census. Attributed profit effects are not causal estimates; annual samples differ.

Gallup / JFF / Families & Workers Fund

What do workers experience? 15,482 US employees, surveyed 26 January–24 March 2026. Effects questions cover 7,845 AI users.

Reported speed, quality and responsibility are perceptions; effects among users cannot be read as outcomes for the whole workforce.

HEPI / Kortext

How does student use compare with institutional provision? 1,054 full-time UK undergraduates; weighted Savanta survey, December 2025, published in the 2026 edition.

Provision is student-reported. The 2026 use question adds wellbeing options, complicating comparisons with earlier editions.

National Literacy Trust

What supports critical AI use? Early-2026 surveys: 40,543 pupils aged 13–18 and 2,567 teachers answering AI questions. A separate study covers 3,073 parents.

School recruitment and a pupil sample largely in England limit generalisation. Routed questions have different bases; parent fieldwork dates were not verified.

Dartmouth College

How does guidance relate to students’ own preparation? 1,003 students at US four-year colleges and universities; College Pulse weighted online panel, 10–23 September 2026. Released 30 October 2026.

Separate, overlapping agreement measures, not complements or an adoption rate. Weighted online-panel self-reports; working paper, peer review not verified. Design effects were not verified. No causal learning outcomes or direct comparison with HEPI. The three figures record agreement or strong agreement, with N=1,003 for each item.

UK Government · AI Adoption Survey 2026

Which UK businesses use AI, and what limits adoption? UK private-sector businesses with at least five employees in SIC A–N and R–S. 3,503 telephone interviews with technology-responsible respondents; Market Location commercial sampling frame; weighted by business size and sector; 5% response rate. Fieldwork: 7 January–21 April 2026; published 29 October 2026.

Broad AI, including pilots, not only generative AI. Selected sectors and a five-employee threshold differ from Eurostat; no direct UK–EU ranking. Self-reports, not a census or causal productivity evidence. Low response creates nonresponse risk; weighting does not establish its absence. The report compares 32% with 16% in the prior wave. These are repeated cross-sections, not a panel; questionnaire and achieved samples changed. The 78% skills-barrier figure covers nonusers planning adoption (unweighted n=236), not current users. Real-estate adoption is omitted: executive summary/figure 2 reports 45%, while the main text reports 42%; unresolved discrepancy.

Reuters Institute / University of Oxford

How often do people use standalone AI, and encounter AI in search? Generative AI and News Report 2026, published 29 October 2026. YouGov online questionnaire; nonprobability samples with quotas and weighting for age, gender, region, education and political leaning. Combined-respondent estimates use YouGov weights, not an unweighted average of country percentages. 2026 fieldwork: 14 August–28 September. Six-country weekly use: Argentina, Denmark, France, Japan, United Kingdom and United States; n=12,565 in 2025 and n=12,774 in 2026. Nine-country search exposure adds Australia, Finland and Norway; n=18,921.

Very or somewhat comfortable; four separate scenarios, not parts of a total. Nine-country weighted online sample, n=18,921; YouGov fieldwork 14 August–28 September 2026, published 29 October. This base differs from the six-country use trend; the figures are not a worldwide estimate.

Acceptance depends on how news is produced. Share very or somewhat comfortable with each scenario. Reuters Institute, 2026 nine-country sample; common 0–100% scale.
Production method0100%Share
Entirely AI-produced12%
Mostly AI, human oversight19%
Mostly human, AI assistance45%
Entirely human-produced67%
Data
Share very or somewhat comfortable; nine-country sample, n=18,921. Separate responses, not a total.
Production methodComfortable
Entirely AI-produced12%
Mostly AI, human oversight19%
Mostly human, AI assistance45%
Entirely human-produced67%

OECD · Regions and Cities at a Glance 2026

How does enterprise adoption vary by region? Figure 1.9 provides 91 regional rates across 12 selected countries. Reference year: 2025. Published: 4 November 2026. Enterprises with at least 10 persons employed in covered nonfinancial sectors; broad AI use.

OECD analysis of existing Eurostat isoc_r_eb_ain2 data, not an independent survey. Selected 2025 regional coverage in 12 countries; not Europe-wide. Regional achieved sample counts and confidence intervals are not supplied in the workbook. Employment exposure in column D is excluded: it has a different denominator. In the selected 2025 data, the simple average regional share of enterprises using AI was 11.43% across 43 Central and Eastern European regions, compared with 26.10% across 48 other covered regions. These are unweighted means of regional rates across 12 countries, not enterprise-weighted adoption rates for Europe.

Covered countries: Austria, Belgium, Croatia, Czechia, Denmark, Hungary, Lithuania, Norway, Poland, Slovak Republic, Spain, Sweden.
OECD — Digital Economy and Society Outlook 2026

Which firms use AI, cloud and analytics together? Figure 3.4; published 5 November 2026.

Reference years are mainly 2025: Korea uses 2024, Canada 2023, Japan 2021–2023, and Australia financial year 2021–2022. The population is enterprises with at least ten employees in covered sectors. National survey coverage varies; the workbook supplies no achieved sample counts or confidence intervals.

AI, cloud and analytics used together. Share of enterprises with at least ten employees in covered sectors. The all-three-technologies measure from OECD Figure 3.4, redrawn from its workbook. Other technology combinations in the original figure are not shown. Black: country rates; red: the unweighted mean of 28 covered OECD members. Mostly 2025; exceptions are labelled.
OECD12.22%
Denmark29.91%
Finland25.48%
Netherlands23.72%
Belgium22.78%
Korea (2024)20.87%
Sweden20.86%
Estonia16.15%
Norway16.14%
Lithuania14.61%
Luxembourg14.29%
Ireland13.46%
Germany12.93%
Austria11.11%
Czech Republic11.04%
Slovenia10.94%
Spain10.70%
Italy10.17%
Slovak Republic8.63%
France8.31%
Latvia8.17%
Portugal7.21%
Hungary5.71%
Poland5.29%
Greece4.67%
Japan (2023)2.94%
Türkiye2.75%
Canada (2023)1.80%
Australia (2022)1.40%
Data
OECD Figure 3.4: all-three-technologies measure
GeographyReference periodShare (%)
OECD2025 or most recent (2021–2025)12.2162086899778
Denmark202529.9112
Finland202525.4826
Netherlands202523.7163
Belgium202522.7793
Korea (2024)202420.8704433193799
Sweden202520.8595
Estonia202516.1476
Norway202516.1432
Lithuania202514.6097
Luxembourg202514.291
Ireland202513.4635
Germany202512.9290999999999
Austria202511.1124
Czech Republic202511.0392
Slovenia202510.9384
Spain202510.6999
Italy202510.1717
Slovak Republic20258.634
France20258.308
Latvia20258.1669
Portugal20257.2088
Hungary20255.7149
Poland20255.2906
Greece20254.6703
Japan (2023)2021–20232.9417
Türkiye20252.7536
Canada (2023)20231.79999999999999
Australia (2022)2021–20221.4

US Census — Business Trends and Outlook Survey

How do businesses report AI use in functions and employee tasks? Two national estimates, retained as separate measures.

Reference period: 5–18 October 2026. Responses were collected 19 October–1 November and published 5 November (cycle 202622). National.xlsx records 24.2% at Response Estimates E16 (business-function use) and 26.8% at E19 (employee generative-AI use reported by the business). Corresponding standard errors are 0.61 and 0.56 percentage points, not confidence intervals. Both denominators are businesses, not employees; the questions can overlap.

Two separate business-reported measures. Share of covered US nonfarm employer businesses, 5–18 October 2026. Redrawn from Census BTOS, National.xlsx, Response Estimates E16 and E19. Both denominators are businesses. The questions overlap; the difference is not an employee-use gap. Standard errors are reported in the Data table.
Business-function AI24.2%
Employee generative AI26.8%
Data
Census BTOS cycle 202622: two business measures
MeasureShare (%)Standard error (pp)
AI use in any business function24.20.61
Business reports employees using generative AI for work26.80.56

Anthropic · AI for scientific discovery

Which research tasks appear in Claude sessions? Published 5 November 2026; observed 2 August–30 September. The core-research sample contains 207,049 sessions: 128,914 Chat/Cowork and 78,135 Claude Code.

Research tasks differ across interfaces. Weighted shares of classified core-research sessions, 2 August–30 September 2026. Anthropic Figure 3, redrawn for all eight task categories. Each interface has its own weighted denominator. These are session shares, not researcher adoption or productivity. Every bar uses a 0–100% scale.

Chat & Cowork

128,914 sampled research sessions

Data analysis33.7%
Writing and communication32.0%
Data gathering11.5%
Reading and knowledge acquisition7.6%
Theoretical analysis5.0%
Design and development4.7%
Ideation and hypothesis generation4.2%
Other research tasks1.3%

Claude Code

78,135 sampled research sessions

Data analysis48.1%
Writing and communication17.6%
Data gathering11.9%
Reading and knowledge acquisition3.7%
Theoretical analysis4.7%
Design and development7.7%
Ideation and hypothesis generation2.1%
Other research tasks4.2%
Data
Anthropic Figure 3: weighted research-session shares
Research taskChat & Cowork (%)Claude Code (%)
Data analysis33.748.1
Writing and communication32.017.6
Data gathering11.511.9
Reading and knowledge acquisition7.63.7
Theoretical analysis5.04.7
Design and development4.77.7
Ideation and hypothesis generation4.22.1
Other research tasks1.34.2

Australian Bureau of Statistics · Job Vacancies

Do businesses perceive an AI effect on recruitment? Reference date: 21 August 2026, the third Friday specified by the methodology. August release published 1 October; AI results added 4 November 2026 at 11:30am AEDT.

Perceived effects on vacancies. Share of responding businesses with at least five employees, reference date 21 August 2026. Redrawn from the ABS recruitment-effect results. Published categories sum to 99.2%; values are retained without normalization or an invented residual. All bars use a 0–100% scale.
No impact on vacancies81.8%
Fewer vacancies3.8%
More vacancies0.6%
Unsure of impact13.0%
Data
ABS perceived AI effects on vacancies, August 2026
Reported effectShare (%)
No impact on vacancies81.8
Fewer vacancies3.8
More vacancies0.6
Unsure of impact13.0

Reserve Bank of Australia · AI liaison

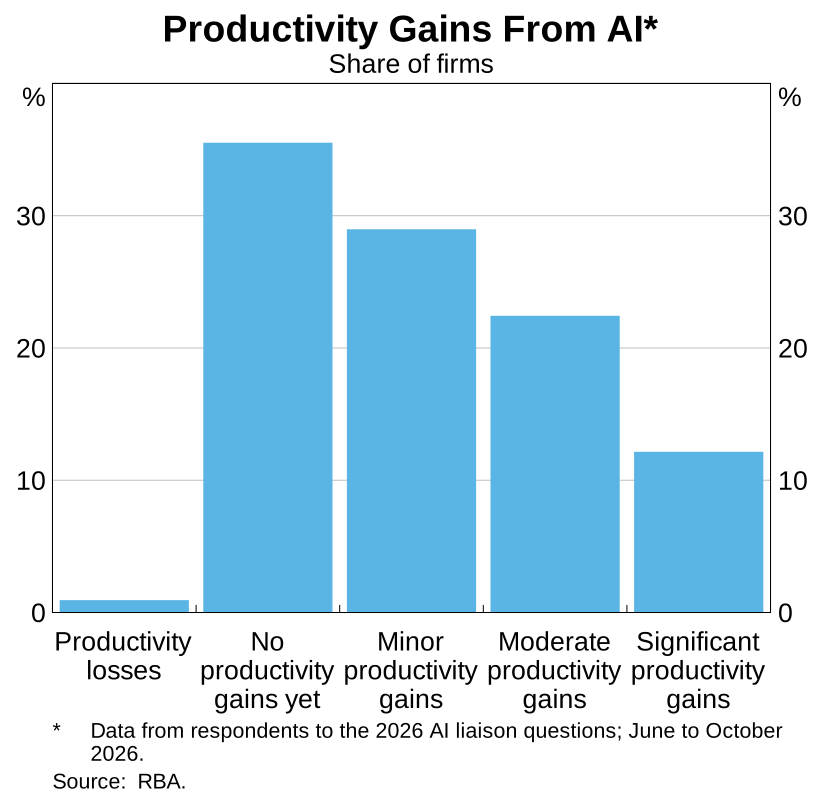
Have firms seen productivity gains yet? Sarah Hunter’s 9 November 2026 speech: Graph 2 covers respondents to AI liaison questions in June–October 2026. Its description puts the share with no gains yet at around 35%; this remains approximate context rather than an exact numeric observation.

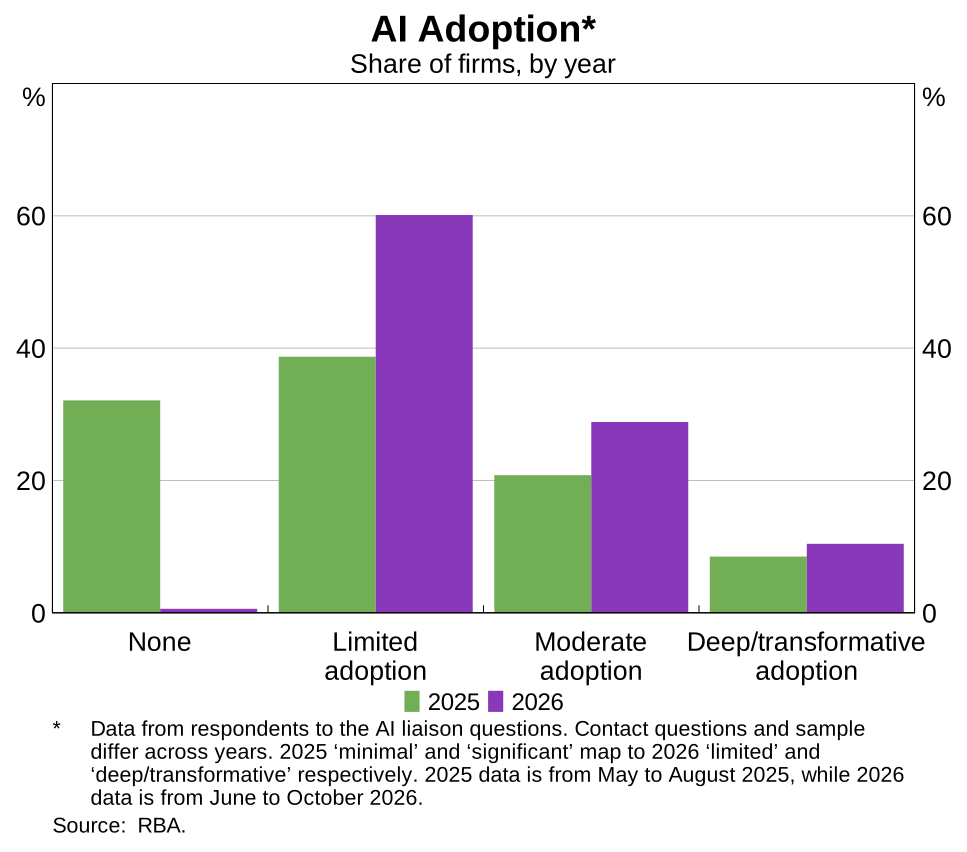
The liaison program seeks broad industry and geographic coverage but mainly covers medium and larger firms. Its respondents are not a representative national firm survey. Reported firm-level effects do not measure aggregate productivity or establish causation.

Graph 1’s 2025–2026 comparison changes questions, samples and observation windows (May–August 2025; June–October 2026). Category mappings also change. No like-for-like annual adoption trend is inferred here.

Kyndryl · 2026–27 Readiness Report

Has organisational redesign accompanied deployment? Published 10 November 2026. Edelman Intelligence surveyed 3,700 senior leaders in 21 countries and 24 industries, using online surveys and telephone interviews, 10 July–2 September 2026.

Half were C-suite and half senior directors or business-unit leaders; half represented business functions and half technology functions. The three observations below share a respondent base but use different response thresholds.

Deployment and organisational redesign. Kyndryl 2026–27 Readiness Report. Senior-leader responses, n=3,700; fieldwork 10 July–2 September 2026. Different response thresholds; not a subtraction-based integration gap.
AI deployed beyond pilot projects · Agree84%
Roles formally redesigned or reorganised around AI · Completely agree27%
Formal AI change-management programmes fully implemented · Completely agree29%
Data
Kyndryl 2026–27 Readiness Report. Senior-leader responses, n=3,700; fieldwork 10 July–2 September 2026. Different response thresholds; not a subtraction-based integration gap.
StatementShareResponse thresholdSource
AI deployed beyond pilot projects84%AgreeQ8; p.9
Roles formally redesigned or reorganised around AI27%Completely agreeQ6; p.25
Formal AI change-management programmes fully implemented29%Completely agreeQ6; p.25

Menlo Ventures · 2026 State of Enterprise AI

How intensively are surveyed enterprises spending? Menlo’s survey reports AI spending at 4.7 times its prior-year level on average, versus a median of 2.2 times. The distance between them suggests spending growth is uneven within the sample. It does not measure how widely AI is adopted or whether it improves productivity.

Published 3 November 2026. Morning Consult surveyed nearly 400 US enterprise decision-makers on 8–26 September 2026. Menlo does not disclose the recruitment frame, response rate or representative weighting. Menlo invests in companies discussed in the report.

Spending growth is uneven. Reported 2026 AI spending relative to 2025; surveyed US enterprises. Multiples, not percentages or adoption rates.
Measure0×5×Multiple
Average4.7×
Median2.2×
Data
Menlo 2026 survey. Fieldwork: 8–26 September 2026. Reported spending relative to 2025.
MeasureMultiplePopulation
Average4.7×Surveyed US enterprises
Median2.2×Surveyed US enterprises

Stanford AI100 · Infrastructure and agency

Published November 2026; expert synthesis of developments from 2021–2026. The infrastructure discussion (pp. 98–105) covers interdependent models, data, networks, chips and data centres, and the consequences of concentrated capacity for sovereignty and agency.

McKinsey Global Institute · AI fluency in job requirements

Agents, robots, and us: Skill partnerships in the age of AI, November 2025. Exhibit 7 combines Lightcast job-posting analysis and US Bureau of Labor Statistics employment: occupations where AI fluency appeared in at least 5% of postings employed about 1.0 million workers in 2023 and 7.0 million in 2025. The report identifies May 2025 postings in its methods.

Dubai Future Foundation · AI in creative industries

Guidelines for the development, regulation, and use of artificial intelligence in creative industries (2024). Research ran from October 2023 to September 2024: two virtual and four in-person participatory-design workshops with 67 participants, expert interviews, and small-scale surveys and opinion polls. The report addresses authorship, compensation and cultural representation.

02 / Reading the evidence

Keep the distinctions visible.

Comparability, denominators and uncertainty

No pooled adoption score is calculated. People, firms, conversations and research sessions remain separate. Publication dates are not observation dates; half-year and quarterly windows have different durations. Percentage-point changes subtract comparable published endpoints, and missing values never mean zero.

Self-reported benefits do not establish causal effects on productivity, job quality or learning. The US workforce and US/UK education surveys remain evidence about their respective populations; they are not directly comparable cross-country estimates.

Revisions, exclusions and source discrepancies

Country comparisons follow the supplied CSV. The Q2 report revises four Q1 values by 0.1 percentage points; original vintages remain available. Conflicting HEPI encouragement and prior-year teacher-training figures are omitted. Eurostat series breaks and category changes remain documented.

Real-estate adoption is omitted: executive summary/figure 2 reports 45%, while the main text reports 42%; unresolved discrepancy. Unlabelled curves are not reconstructed from pixels. Read the full editorial decisions and transcription notes ↗.

Attribution and reuse

Research belongs to its respective creators. Microsoft’s collection carries an MIT notice; JRC uses CC BY 4.0, with exclusions. Anthropic’s dataset specifies CC-BY without a version. Other reports retain publisher rights; numerical facts are transcribed and charts redrawn. The UK government publication uses the Open Government Licence v3.0 except where otherwise stated. Reuters Institute permits reproduction under CC BY with attribution. No single licence covers the whole collection.

Microsoft’s original licence ↗ All attribution and reuse notes ↗

03 / The library

Regional values · CSV · Data and provenance · JSON · OECD workbook ↗

Go directly to the material.