Explore the evidence / Evidence library
Follow the evidence.
Search the transcribed tables, read every original report page, and find all datasets, methods and reuse notes.
Find a chart, dataset, or source
- Acceptance of AI-produced newsWorld geography · nine-country attitudes
- Enterprise spending intensityOrganisations · supplementary survey
- Australia: perceived recruitment effectsWork · ABS reported vacancy effects
- Australia: productivity gains in liaisonWork · RBA approximate context
- OECD technology co-useOrganisations · 28 countries and published mean
- US business and employee-use reportsOrganisations · two separate business measures
- OECD regional enterprise adoptionOrganisations · 91 regions
- Reuters Institute: weekly use and search exposureAccess & geography · separate survey measures
- UK business AI use and skills barriersOrganisations · separate UK survey
- One world. Two different measures.World geography
- How many people use generative AI?World geography
- Where is Claude used disproportionately?World geography
- Read one place across the evidence.World geography
- United Arab EmiratesWorld geography
- Use rises. The gaps remain.World geography
- Adoption rises; the North–South gap widens.World geography
- All 147 economies move upward.World geography
- The ten largest gainsWorld geography
- All four periods, side by side.World geography
- Population reachWorld geography
- National averages conceal local variation.United States
- Every county counts once.United States
- From states to individual counties.United States
- Adoption differs across European economies.Organisations
- Where European firms have adopted AIOrganisations
- Read sector growth with its coverage.Organisations
- Sector growth needs a coverage lensOrganisations
- Size, scaling and returns answer different questions.Organisations
- Larger firms pull ahead with agentsOrganisations
- Personal gains and organisational returnsOrganisations
- Deployment expanded across functions.Organisations
- Use differs by education and role.Work & learning
- Use across the workforceWork & learning
- Access differs by education and roleWork & learning
- Faster work is one outcome among several.Work & learning
- What AI users reportWork & learning
- Widespread use meets uneven provision.Work & learning
- Students use more than institutions provide.Work & learning
- A gap between teacher use and training.Work & learning
- Adoption does not establish critical use.Work & learning
- Critical use is uneven within adoption.Work & learning
- What adoption leaves unresolved.Work & learning
- Conversations extend beyond paid work.AI tasks
- Purpose of Claude conversationsAI tasks
- Answers, documents and guidance are common outputs.AI tasks
- Three common outputsAI tasks
- The same output can serve different purposes.AI tasks
- The same output, different purposesAI tasks
- Behind the headline numbers.Evidence library
- Microsoft research in brief.Evidence library
- Five reports. Every page.Evidence library
- Global · H1 2025Evidence library
- Global · H2 2025Evidence library
- Global · Q1 2026Evidence library
- Global · Q2 2026Evidence library
- United States · Q1 2026Evidence library
- Data, reports and source files.Evidence library
- Microsoft geographic dataEvidence library
- Survey, sector and geographic evidenceEvidence library
- Five original reportsEvidence library
- Transcriptions and provenanceEvidence library
- Methods, caveats and attribution.Evidence library
- Know what each number can carry.Evidence library
- The Microsoft collection: definitions and provenance.Evidence library
- All datasets and downloads · CSV, JSON, PDF and textEvidence library
- Read all 94 original report pagesEvidence library
- Search 65 transcribed tables and recordsEvidence library
- Complete methods, caveats, provenance and licencesEvidence library
- 147 economies · four-period table and country searchWorld geography
- US states, metros and all 3,143 counties · search, filter, exportUnited States
- Science · eight research tasks, two interfacesAI tasks · session shares
No matching views. Try a broader topic, or browse the six areas above.
Evidence library
Behind the headline numbers.
Exact tables and labelled values from five Microsoft reports. Each record retains its edition, units, source page and limitations.
Microsoft research in brief · ten findings with source pages
Microsoft research in brief.
Ten findings from Microsoft’s AI Diffusion research. Adoption means the estimated share of people aged 15–64 using generative AI during the reporting period; adoption changes are in percentage points (pp).
-
Global use is rising broadly.
Worldwide adoption reached 18.8% in Q2 2026, up from 17.8% in Q1 and 16.3% in H2 2025. In the supplied country dataset, 145 of 147 economies recorded an increase from Q1 to Q2.
-
The UAE and Singapore lead adoption.
The United Arab Emirates (73.3%) and Singapore (64.3%) have the highest Q2 2026 user shares. Ireland follows at 49.9%, then France at 49.6% and Norway at 49.4%.
-
South Korea is gaining fastest.
The largest Q1–Q2 2026 increases were South Korea (+3.5 pp), the UAE (+3.2 pp) and Japan (+2.2 pp), reaching 40.6%, 73.3% and 24.7% respectively. South Korea also leads growth since H1 2025, at +14.7 pp.
-
Some economies remain near 6% adoption.
Q2 2026 adoption is lowest in Cambodia (6.1%), followed by Afghanistan, Tajikistan and Turkmenistan (6.3% each). The weakest quarterly growth was in Papua New Guinea and Syria, the only declines in the CSV: −0.1 pp each, to 7.6% and 7.4%.
-
The North–South divide is widening.
In Q2 2026, adoption reached 28.8% in the Global North and 16.2% in the Global South. The gap grew from 10.6 pp in H2 2025 to 12.6 pp, as the North added more percentage points in both 2026 quarters.
-
Platform choice has a geopolitical pattern.
The H2 2025 report describes strong DeepSeek uptake in China, Russia, Iran, Cuba and Belarus, alongside parts of Africa. Microsoft connects its reach with restrictions on access to U.S. services, affordability and distribution partnerships. This is the report’s interpretation of observed patterns.
-
U.S. metropolitan adoption is twice rural adoption.
For Q1 2026, the U.S. report estimates average AI user shares of 32.9% in metropolitan counties, 21.8% in micropolitan counties and 16.2% in rural counties. These local estimates expose a substantial geographic divide within one country.
-
Young-adult communities stand out.
U.S. counties where more than 10% of residents are ages 18–24 average 28.6% AI user share, versus 20.3% elsewhere. The report associates younger populations and university communities with higher use; these county-level comparisons do not establish causation.
-
Access barriers extend beyond AI tools.
The Q1 2026 report compares internet access of 90.1% in the Global North with 65.7% in the Global South, using separate connectivity indicators. The H1 2025 research also identifies limited local-language support as a barrier, alongside electricity, connectivity and digital skills.
-
Learning has a larger role in Global South use.
Among the consumer Copilot conversations studied, self-directed learning’s share was 29.2% higher in the Global South than globally; schoolwork’s share was 32.3% higher. These are relative differences, not pp, and describe the sampled early adopters rather than all AI users.
Country comparisons follow the supplied CSV; report vintages and methods are documented below. Half-year and quarterly reporting windows differ. Adoption measures usage, not productivity or proficiency. Read the methods and limitations ↓
65 of 65 records
Download all records · JSON01Historical economic comparison in report proseGlobal · H1 2025 · page 4 · 2 rows
Time interval for these quoted growth rates is not specified in paragraph. Report also says both economies had about $2,000 per capita income in 1960 (2025 dollars), and South Korea doubled living standards every eleven years. The GDP chart’s exact annual series is not printed.
Read source page · Open original PDF
| Economy | Annual economic growth (%) |
|---|---|
| South Korea | 6.2 |
| Philippines | 1.8 |
02Population and prerequisites for AI accessGlobal · H1 2025 · page 7 · 5 rows
Exact labels on source pyramid. “Datacenters” is an additional qualitative layer with no numeric count. Source references population 2024, electricity, internet 2024, and digital-literacy data.
Read source page · Open original PDF
| Measure | Billion people |
|---|---|
| World population | 8.1 |
| With electricity | 7.4 |
| Access to internet | 5.5 |
| Basic digital skills | 4.2 |
| AI users | 1.2 |
03Sub-Saharan Africa share of global population without electricityGlobal · H1 2025 · page 8 · 2 rows
Exact percentages in prose; report says over 750 million people globally lack electricity and 18 of the 20 countries with largest electricity-access deficits are in Sub-Saharan Africa.
Read source page · Open original PDF
| Period | Share (%) |
|---|---|
| 2010 | 50 |
| Report time | 85 |
04Zambia: connectivity and AI adoptionGlobal · H1 2025 · page 10 · 2 rows
Rounded narrative values. H1 appendix gives national diffusion 11.7%. Distinct denominators: not directly comparable counts.
Read source page · Open original PDF
| Population denominator | AI adoption (%) |
|---|---|
| National population | 12 |
| People with internet access | 34 |
05English representation in web content and populationGlobal · H1 2025 · page 12 · 2 rows
Rounded narrative shares (“half” and “just 5%”). Different denominators; these are not parts of a common whole.
Read source page · Open original PDF
| Measure | Share (%) |
|---|---|
| Open web content in English | 50 |
| Native English speakers in world population | 5 |
06Further language-access countsGlobal · H1 2025 · page 12 · 2 rows
Counts and bounds printed in the report. The detailed language shares in the treemap are not numerically labelled.
Read source page · Open original PDF
| Metric | Value as stated |
|---|---|
| Malawi population speaking English fluently | Fewer than 4% |
| Other spoken languages in web-content illustration | 7,000+ |
07Language barrier: numerical claimsGlobal · H1 2025 · page 13 · 6 rows
Narrative bounds retained; no original detailed data table is supplied.
Read source page · Open original PDF
| Metric | Value as stated |
|---|---|
| Swahili speakers | Over 200 million |
| German/Swahili digital content disparity | Swahili has over 500 times less content |
| AI adoption in low-resource language countries | 20% lower, controlling for GDP/connectivity |
| LLM accuracy in English | Around 80% |
| LLM accuracy for some low-resource languages such as Yoruba | Below 55% |
| Yoruba speakers across Africa | More than 50 million |
08Open model ecosystem claimGlobal · H1 2025 · page 15 · 1 row
Narrative claim attributed by report to VentureBeat reference 29.
Read source page · Open original PDF
| Metric | Value as stated |
|---|---|
| LLaMA community variant models | Over 7,000 within months of debut |
09AI frontier index and months to frontierGlobal · H1 2025 · page 16 · 7 rows
Visually transcribed from original table. Frontier index is normalized; time lag is in months. Original prose rounds Israel lag to 11 months or less than a year.
Read source page · Open original PDF
| Country | Best model | Frontier index | Months to frontier |
|---|---|---|---|
| United States | GPT-5 (high) | 1.0 | 0.0 |
| China | DeepSeek V3.1 Terminus (Reasoning) | 0.841 | 5.3 |
| South Korea | EXAONE 4.0 32B (Reasoning) | 0.824 | 5.9 |
| France | Magistral Medium 1.2 | 0.789 | 7.0 |
| United Kingdom | Gemma 3 27B Instruct | 0.768 | 7.7 |
| Canada | Command A | 0.767 | 7.8 |
| Israel | Jamba 1.7 Large | 0.651 | 11.6 |
10Installed data center capacity, mid-2025Global · H1 2025 · page 17 · 14 rows
Visually transcribed original table. Report describes IEA estimates. Region labels preserved; Brazil and Central/South America both appear as printed. The prose claim “US and China 86%” is not supported by treating these rows as disjoint components.
Read source page · Open original PDF
| IEA region | Installed capacity (GW) |
|---|---|
| United States | 53.7 |
| China | 31.9 |
| European Union | 11.9 |
| Japan and South Korea | 6.9 |
| India | 3.5 |
| Other Asia Pacific | 3.1 |
| United Kingdom | 2.6 |
| Australia and New Zealand | 1.6 |
| Other North America | 1.5 |
| Africa | 1.5 |
| Central and South America | 1.4 |
| Eurasia | 1.2 |
| Middle East | 1.1 |
| Brazil | 0.6 |
11Additional quantitative claimsGlobal · H1 2025 · page 18 · 8 rows
Rounded report claims; broad-region exact figures appear in later H2 report. Capacity percentage conflicts with table if its regions are summed. Same claims recur on pages 2–3.
Read source page · Open original PDF
| Metric | Value as stated |
|---|---|
| AI users | More than 1.2 billion in under 36 months |
| People lacking basic AI-access capabilities | About four billion / nearly half of humanity |
| AI adoption in Global North | Approximately 23% |
| AI adoption in Global South | Approximately 13% |
| GDP per capita threshold with largest adoption disparities | Below $20,000 |
| US and China share of global compute | Roughly 86% |
| Countries hosting frontier-level models | Seven |
| Windows devices underlying telemetry | Over one billion |
12AI diffusion data sourceGlobal · H1 2025 · page 19 · 74 rows
Values visually verified against original H1 appendix and match H1 column in H2 appendix. Rows sorted by printed diffusion; source does not explicitly assign ranks and equal values need not have unique ranks.
Read source page · Open original PDF
| Economy | H1 2025 AI diffusion (%) |
|---|---|
| United Arab Emirates | 59.4 |
| Singapore | 58.6 |
| Norway | 45.3 |
| Ireland | 41.7 |
| France | 40.9 |
| Spain | 39.7 |
| New Zealand | 37.6 |
| United Kingdom | 36.4 |
| Netherlands | 36.3 |
| Qatar | 35.7 |
| Australia | 34.5 |
| Israel | 33.9 |
| Belgium | 33.5 |
| Canada | 33.5 |
| Switzerland | 32.4 |
| Sweden | 31.2 |
| Austria | 29.1 |
| Hungary | 27.9 |
| Denmark | 26.6 |
| Germany | 26.5 |
| Poland | 26.4 |
| Taiwan | 26.4 |
| United States | 26.3 |
| Czechia | 26.0 |
| South Korea | 25.9 |
| Italy | 25.8 |
| Finland | 25.6 |
| Bulgaria | 25.4 |
| Jordan | 25.4 |
| Costa Rica | 25.1 |
| Lebanon | 24.8 |
| Slovenia | 24.6 |
| Saudi Arabia | 23.7 |
| Oman | 22.6 |
| Portugal | 22.4 |
| Jamaica | 22.2 |
| Slovakia | 22.1 |
| Dominican Republic | 22.0 |
| Croatia | 21.8 |
| Vietnam | 21.2 |
| Lithuania | 21.0 |
| Uruguay | 20.9 |
| Colombia | 20.4 |
| Panama | 20.3 |
| Serbia | 19.7 |
| Chile | 19.6 |
| South Africa | 19.3 |
| Malaysia | 18.3 |
| Bosnia and Herzegovina | 18.2 |
| Argentina | 17.8 |
| Kuwait | 17.7 |
| Greece | 17.7 |
| Georgia | 17.3 |
| Philippines | 17.1 |
| Ecuador | 17.0 |
| Japan | 16.7 |
| Mexico | 16.7 |
| Moldova | 16.6 |
| Albania | 15.8 |
| Brazil | 15.6 |
| China | 15.4 |
| Romania | 15.3 |
| El Salvador | 14.6 |
| India | 14.2 |
| Azerbaijan | 14.2 |
| Guatemala | 13.7 |
| Peru | 13.4 |
| Türkiye | 13.4 |
| Namibia | 13.0 |
| Botswana | 12.8 |
| Libya | 12.7 |
| Kazakhstan | 12.7 |
| Mongolia | 12.6 |
| Egypt | 12.5 |
13AI diffusion data sourceGlobal · H1 2025 · page 20 · 73 rows
Values visually verified against original H1 appendix and match H1 column in H2 appendix. Rows sorted by printed diffusion; source does not explicitly assign ranks and equal values need not have unique ranks.
Read source page · Open original PDF
| Economy | H1 2025 AI diffusion (%) |
|---|---|
| Honduras | 12.4 |
| Senegal | 12.4 |
| Gabon | 12.3 |
| Nepal | 12.3 |
| Tunisia | 12.3 |
| Indonesia | 11.7 |
| Zambia | 11.7 |
| Algeria | 11.3 |
| Bolivia | 10.9 |
| Côte d’Ivoire | 10.8 |
| Gambia | 10.6 |
| Morocco | 10.5 |
| Iraq | 10.3 |
| Paraguay | 10.1 |
| Nicaragua | 10.0 |
| Pakistan | 9.7 |
| Iran | 9.6 |
| Thailand | 9.1 |
| Ukraine | 9.1 |
| Angola | 8.9 |
| Madagascar | 8.9 |
| Malawi | 8.9 |
| Mozambique | 8.9 |
| Lesotho | 8.8 |
| Benin | 8.7 |
| Burkina Faso | 8.7 |
| Ghana | 8.7 |
| Guinea | 8.7 |
| Guinea-Bissau | 8.7 |
| Liberia | 8.7 |
| Mali | 8.7 |
| Mauritania | 8.7 |
| Niger | 8.7 |
| Nigeria | 8.7 |
| Sierra Leone | 8.7 |
| Togo | 8.7 |
| Myanmar | 8.4 |
| French Guiana | 8.3 |
| Guyana | 8.3 |
| Suriname | 8.3 |
| Venezuela | 8.3 |
| Kenya | 7.8 |
| Belarus | 7.6 |
| Kyrgyzstan | 7.6 |
| Russia | 7.6 |
| Papua New Guinea | 7.2 |
| Haiti | 7.1 |
| Cameroon | 7.0 |
| Central African Republic | 7.0 |
| Chad | 7.0 |
| Congo | 7.0 |
| Congo (DRC) | 7.0 |
| Zimbabwe | 6.9 |
| Syria | 6.7 |
| Bangladesh | 6.5 |
| Burundi | 6.4 |
| Eritrea | 6.4 |
| Ethiopia | 6.4 |
| Somalia | 6.4 |
| South Sudan | 6.4 |
| Sudan | 6.4 |
| Tanzania | 6.4 |
| Uganda | 6.4 |
| Armenia | 6.2 |
| Sri Lanka | 6.2 |
| Laos | 6.0 |
| Rwanda | 6.0 |
| Uzbekistan | 5.7 |
| Cuba | 5.7 |
| Afghanistan | 5.1 |
| Tajikistan | 5.1 |
| Turkmenistan | 5.1 |
| Cambodia | 4.6 |
14AI diffusion by broad regionGlobal · H2 2025 · page 2 · 3 rows
Also plotted on page 5 for North and South.
Read source page · Open original PDF
| Region | H1 2025 (%) | H2 2025 (%) | Change (pp) |
|---|---|---|---|
| Global North | 22.9 | 24.7 | 1.8 |
| Global South | 13.1 | 14.1 | 1.0 |
| World | 15.1 | 16.3 | 1.2 |
15Top 30 diffusion over timeGlobal · H2 2025 · page 4 · 30 rows
Distinct rank and change labels from page 4. Source calls Czechia “Czech Republic” here. Chart changes differ from appendix for UAE, Switzerland, Sweden, Austria and United States. Do not silently merge change labels.
Read source page · Open original PDF
| Economy | H1 rank | H2 rank | H1 diffusion (%) | H2 diffusion (%) | Chart change (pp) |
|---|---|---|---|---|---|
| United Arab Emirates | 1 | 1 | 59.4 | 64.0 | 4.6 |
| Singapore | 2 | 2 | 58.6 | 60.9 | 2.3 |
| Norway | 3 | 3 | 45.3 | 46.4 | 1.1 |
| Ireland | 4 | 4 | 41.7 | 44.6 | 2.9 |
| France | 5 | 5 | 40.9 | 44.0 | 3.1 |
| Spain | 6 | 6 | 39.7 | 41.8 | 2.1 |
| New Zealand | 7 | 7 | 37.6 | 40.5 | 2.9 |
| Netherlands | 9 | 8 | 36.3 | 38.9 | 2.6 |
| United Kingdom | 8 | 9 | 36.4 | 38.9 | 2.5 |
| Qatar | 10 | 10 | 35.7 | 38.3 | 2.6 |
| Australia | 11 | 11 | 34.5 | 36.9 | 2.4 |
| Israel | 12 | 12 | 33.9 | 36.1 | 2.2 |
| Belgium | 14 | 13 | 33.5 | 36.0 | 2.5 |
| Canada | 13 | 14 | 33.5 | 35.0 | 1.5 |
| Switzerland | 15 | 15 | 32.4 | 34.8 | 2.4 |
| Sweden | 16 | 16 | 31.2 | 33.3 | 2.1 |
| Austria | 17 | 17 | 29.1 | 31.4 | 2.3 |
| South Korea | 25 | 18 | 25.9 | 30.7 | 4.8 |
| Hungary | 18 | 19 | 27.9 | 29.8 | 1.9 |
| Denmark | 19 | 20 | 26.6 | 28.7 | 2.1 |
| Germany | 20 | 21 | 26.5 | 28.6 | 2.1 |
| Poland | 21 | 22 | 26.4 | 28.5 | 2.1 |
| Taiwan | 22 | 23 | 26.4 | 28.4 | 2.0 |
| United States | 23 | 24 | 26.3 | 28.3 | 2.0 |
| Czechia | 24 | 25 | 26.0 | 27.8 | 1.8 |
| Italy | 26 | 26 | 25.8 | 27.8 | 2.0 |
| Bulgaria | 28 | 27 | 25.4 | 27.3 | 1.9 |
| Finland | 27 | 28 | 25.6 | 27.3 | 1.7 |
| Jordan | 29 | 29 | 25.4 | 27.0 | 1.6 |
| Costa Rica | 30 | 30 | 25.1 | 26.5 | 1.4 |
16Global North–South adoption gapGlobal · H2 2025 · page 5 · 2 rows
As printed. Calculating from rounded H1 endpoints 22.9−13.1 gives 9.8.
Read source page · Open original PDF
| Period | Gap (percentage points) |
|---|---|
| H1 2025 | 9.8 |
| H2 2025 | 10.6 |
17Ten economies with largest published gainsGlobal · H2 2025 · page 6 · 10 rows
Source table prints UAE change as 4.50%, whereas 64.0−59.4 = 4.6 pp and page 4 prints 4.6%.
Read source page · Open original PDF
| Economy | H1 2025 (%) | H2 2025 (%) | Published change (pp) |
|---|---|---|---|
| South Korea | 25.9 | 30.7 | 4.8 |
| United Arab Emirates | 59.4 | 64.0 | 4.5 |
| France | 40.9 | 44.0 | 3.1 |
| New Zealand | 37.6 | 40.5 | 2.9 |
| Ireland | 41.7 | 44.6 | 2.9 |
| Qatar | 35.7 | 38.3 | 2.6 |
| Netherlands | 36.3 | 38.9 | 2.6 |
| United Kingdom | 36.4 | 38.9 | 2.5 |
| Saudi Arabia | 23.7 | 26.2 | 2.5 |
| Belgium | 33.5 | 36.0 | 2.5 |
18AI user base growth: labelled South Korea barGlobal · H2 2025 · page 7 · 1 row
Chart title says “H1 2025 to H2 2025”, but adjacent prose discusses growth since October 2024. Other grey bars have no labels. Do not interpret this as the change between the report’s H1/H2 diffusion rates.
Read source page · Open original PDF
| Economy | Growth (%) |
|---|---|
| South Korea | 81.4 |
19Growth since October 2024: narrative comparisonsGlobal · H2 2025 · page 7 · 3 rows
Period from prose; growth metric is user base, distinct from diffusion percentage-point change. Chart calls South Korea 81.4% but has a conflicting period label.
Read source page · Open original PDF
| Economy | Growth as stated |
|---|---|
| South Korea | More than 80% |
| World | 35% |
| United States | 25% |
20Korean SAT / CSAT benchmark scoreGlobal · H2 2025 · page 8 · 3 rows
Exact scores from prose, not percentiles. Source cites Korean SAT LLM leaderboard.
Read source page · Open original PDF
| Model | Score |
|---|---|
| GPT-3.5 | 16 |
| GPT-4o | 75 |
| GPT-5 | 100 |
21English and Korean benchmark percentilesGlobal · H2 2025 · page 8 · 6 rows
Ranges/bounds preserved. Original chart incorrectly repeats title “AI User Share in the Global South and Global North”; benchmark content and adjacent text identify the intended subject.
Read source page · Open original PDF
| Model | Language | Reported percentile |
|---|---|---|
| GPT-3.5 | English | ~70–80th |
| GPT-3.5 | Korean | <5th |
| GPT-4o | English | ~90–95th |
| GPT-4o | Korean | ~70th |
| GPT-5 | English | >95th |
| GPT-5 | Korean | >95th |
22AI trust in 2025Global · H2 2025 · page 9 · 3 rows
Approximate figures in report prose attributed to 2025 Edelman Trust Barometer. Report calls UAE–US difference 35 pp.
Read source page · Open original PDF
| Population | Trust in AI (%) |
|---|---|
| United Arab Emirates | 67 |
| United States | 32 |
| Western European nations average | 32 |
23DeepSeek market share: explicitly labelled economiesGlobal · H2 2025 · page 10 · 4 rows
Only four printed numeric labels. The map additionally encodes bins (≤5%, 6–10%, 11–15%, 16–20%, 21–25%, >25%); do not infer exact shares for other countries from colour.
Read source page · Open original PDF
| Economy | DeepSeek market share (%) |
|---|---|
| China | 89 |
| Belarus | 56 |
| Cuba | 49 |
| Russia | 43 |
24DeepSeek usage in Africa relative to other regionsGlobal · H2 2025 · page 10 · 1 row
Estimated range stated in prose. No constituent country values are printed.
Read source page · Open original PDF
| Comparison | Reported multiplier |
|---|---|
| Africa relative to other regions | 2–4× |
25AI diffusion appendixGlobal · H2 2025 · page 14 · 40 rows
Original vintage. Published change labels transcribed as printed; they may differ from differences calculated from rounded endpoint values. Source prints percentage signs for change.
Read source page · Open original PDF
| Economy | H1 2025 (%) | H2 2025 (%) | Published change (pp) |
|---|---|---|---|
| United Arab Emirates | 59.4 | 64.0 | 4.5 |
| Singapore | 58.6 | 60.9 | 2.3 |
| Norway | 45.3 | 46.4 | 1.1 |
| Ireland | 41.7 | 44.6 | 2.9 |
| France | 40.9 | 44.0 | 3.1 |
| Spain | 39.7 | 41.8 | 2.1 |
| New Zealand | 37.6 | 40.5 | 2.9 |
| Netherlands | 36.3 | 38.9 | 2.6 |
| United Kingdom | 36.4 | 38.9 | 2.5 |
| Qatar | 35.7 | 38.3 | 2.6 |
| Australia | 34.5 | 36.9 | 2.4 |
| Israel | 33.9 | 36.1 | 2.2 |
| Belgium | 33.5 | 36.0 | 2.5 |
| Canada | 33.5 | 35.0 | 1.5 |
| Switzerland | 32.4 | 34.8 | 2.5 |
| Sweden | 31.2 | 33.3 | 2.2 |
| Austria | 29.1 | 31.4 | 2.2 |
| South Korea | 25.9 | 30.7 | 4.8 |
| Hungary | 27.9 | 29.8 | 1.9 |
| Denmark | 26.6 | 28.7 | 2.1 |
| Germany | 26.5 | 28.6 | 2.1 |
| Poland | 26.4 | 28.5 | 2.1 |
| Taiwan | 26.4 | 28.4 | 2.0 |
| United States | 26.3 | 28.3 | 2.1 |
| Czechia | 26.0 | 27.8 | 1.8 |
| Italy | 25.8 | 27.8 | 2.0 |
| Bulgaria | 25.4 | 27.3 | 1.9 |
| Finland | 25.6 | 27.3 | 1.7 |
| Jordan | 25.4 | 27.0 | 1.6 |
| Costa Rica | 25.1 | 26.5 | 1.4 |
| Slovenia | 24.6 | 26.5 | 2.0 |
| Saudi Arabia | 23.7 | 26.2 | 2.5 |
| Lebanon | 24.8 | 25.7 | 0.9 |
| Oman | 22.6 | 24.2 | 1.6 |
| Portugal | 22.4 | 24.2 | 1.8 |
| Slovakia | 22.1 | 23.8 | 1.7 |
| Croatia | 21.8 | 23.7 | 1.9 |
| Vietnam | 21.2 | 23.5 | 2.3 |
| Dominican Republic | 22.0 | 22.7 | 0.8 |
| Uruguay | 20.9 | 22.5 | 1.6 |
26AI diffusion appendixGlobal · H2 2025 · page 15 · 40 rows
Original vintage. Published change labels transcribed as printed; they may differ from differences calculated from rounded endpoint values. Source prints percentage signs for change.
Read source page · Open original PDF
| Economy | H1 2025 (%) | H2 2025 (%) | Published change (pp) |
|---|---|---|---|
| Lithuania | 21.0 | 22.4 | 1.3 |
| Jamaica | 22.2 | 22.1 | -0.1 |
| Colombia | 20.4 | 22.0 | 1.6 |
| Panama | 20.3 | 21.5 | 1.2 |
| Serbia | 19.7 | 21.5 | 1.8 |
| South Africa | 19.3 | 21.1 | 1.8 |
| Chile | 19.6 | 20.8 | 1.2 |
| Malaysia | 18.3 | 19.7 | 1.4 |
| Argentina | 17.8 | 19.6 | 1.8 |
| Bosnia And Herzegovina | 18.2 | 19.5 | 1.3 |
| Kuwait | 17.7 | 19.1 | 1.4 |
| Greece | 17.7 | 19.1 | 1.4 |
| Japan | 16.7 | 19.1 | 2.4 |
| Philippines | 17.1 | 18.3 | 1.2 |
| Georgia | 17.3 | 18.2 | 0.9 |
| Mexico | 16.7 | 17.8 | 1.1 |
| Ecuador | 17.0 | 17.7 | 0.8 |
| Brazil | 15.6 | 17.1 | 1.5 |
| Moldova | 16.6 | 17.0 | 0.4 |
| Albania | 15.8 | 16.5 | 0.7 |
| China | 15.4 | 16.3 | 0.9 |
| Romania | 15.3 | 16.2 | 0.9 |
| El Salvador | 14.6 | 16.2 | 1.6 |
| India | 14.2 | 15.7 | 1.4 |
| Azerbaijan | 14.2 | 15.5 | 1.3 |
| Guatemala | 13.7 | 14.8 | 1.1 |
| Peru | 13.4 | 14.7 | 1.2 |
| Türkiye | 13.4 | 14.6 | 1.2 |
| Mongolia | 12.6 | 14.3 | 1.7 |
| Namibia | 13.0 | 13.8 | 0.9 |
| Libya | 12.7 | 13.7 | 1.1 |
| Kazakhstan | 12.7 | 13.7 | 1.1 |
| Botswana | 12.8 | 13.7 | 0.9 |
| Gabon | 12.3 | 13.4 | 1.1 |
| Egypt | 12.5 | 13.4 | 0.9 |
| Honduras | 12.4 | 13.1 | 0.7 |
| Nepal | 12.3 | 13.0 | 0.8 |
| Senegal | 12.4 | 12.9 | 0.5 |
| Indonesia | 11.7 | 12.7 | 1.1 |
| Tunisia | 12.3 | 12.7 | 0.4 |
27AI diffusion appendixGlobal · H2 2025 · page 16 · 40 rows
Original vintage. Published change labels transcribed as printed; they may differ from differences calculated from rounded endpoint values. Source prints percentage signs for change.
Read source page · Open original PDF
| Economy | H1 2025 (%) | H2 2025 (%) | Published change (pp) |
|---|---|---|---|
| Zambia | 11.7 | 12.3 | 0.5 |
| Algeria | 11.3 | 12.0 | 0.8 |
| Cote D'Ivoire | 10.8 | 11.7 | 0.8 |
| Bolivia | 10.9 | 11.6 | 0.7 |
| Iraq | 10.3 | 11.2 | 0.9 |
| Paraguay | 10.1 | 11.0 | 0.9 |
| Morocco | 10.5 | 10.9 | 0.3 |
| Gambia | 10.6 | 10.9 | 0.2 |
| Thailand | 9.1 | 10.7 | 1.6 |
| Nicaragua | 10.0 | 10.7 | 0.7 |
| Iran | 9.6 | 10.7 | 1.1 |
| Pakistan | 9.7 | 10.3 | 0.7 |
| Angola | 8.9 | 9.7 | 0.8 |
| Madagascar | 8.9 | 9.7 | 0.8 |
| Malawi | 8.9 | 9.7 | 0.8 |
| Mozambique | 8.9 | 9.7 | 0.8 |
| Benin | 8.7 | 9.3 | 0.6 |
| Burkina Faso | 8.7 | 9.3 | 0.6 |
| Ghana | 8.7 | 9.3 | 0.6 |
| Guinea | 8.7 | 9.3 | 0.6 |
| Guinea-Bissau | 8.7 | 9.3 | 0.6 |
| Liberia | 8.7 | 9.3 | 0.6 |
| Mali | 8.7 | 9.3 | 0.6 |
| Mauritania | 8.7 | 9.3 | 0.6 |
| Niger | 8.7 | 9.3 | 0.6 |
| Nigeria | 8.7 | 9.3 | 0.6 |
| Sierra Leone | 8.7 | 9.3 | 0.6 |
| Togo | 8.7 | 9.3 | 0.6 |
| Lesotho | 8.8 | 9.1 | 0.4 |
| Myanmar | 8.4 | 9.1 | 0.7 |
| Ukraine | 9.1 | 9.0 | -0.1 |
| French Guiana | 8.3 | 9.0 | 0.7 |
| Guyana | 8.3 | 9.0 | 0.7 |
| Suriname | 8.3 | 9.0 | 0.7 |
| Venezuela | 8.3 | 9.0 | 0.7 |
| Belarus | 7.6 | 8.4 | 0.8 |
| Kyrgyzstan | 7.6 | 8.2 | 0.7 |
| Kenya | 7.8 | 8.1 | 0.3 |
| Russia | 7.6 | 8.0 | 0.4 |
| Cameroon | 7.0 | 7.8 | 0.7 |
28AI diffusion appendixGlobal · H2 2025 · page 17 · 27 rows
Original vintage. Published change labels transcribed as printed; they may differ from differences calculated from rounded endpoint values. Source prints percentage signs for change.
Read source page · Open original PDF
| Economy | H1 2025 (%) | H2 2025 (%) | Published change (pp) |
|---|---|---|---|
| Central African Republic | 7.0 | 7.8 | 0.7 |
| Chad | 7.0 | 7.8 | 0.7 |
| Congo | 7.0 | 7.8 | 0.7 |
| Congo (DRC) | 7.0 | 7.8 | 0.7 |
| Haiti | 7.1 | 7.6 | 0.5 |
| Zimbabwe | 6.9 | 7.6 | 0.6 |
| Papua New Guinea | 7.2 | 7.3 | 0.2 |
| Syria | 6.7 | 7.1 | 0.4 |
| Bangladesh | 6.5 | 7.1 | 0.6 |
| Burundi | 6.4 | 6.8 | 0.4 |
| Eritrea | 6.4 | 6.8 | 0.4 |
| Ethiopia | 6.4 | 6.8 | 0.4 |
| Somalia | 6.4 | 6.8 | 0.4 |
| South Sudan | 6.4 | 6.8 | 0.4 |
| Sudan | 6.4 | 6.8 | 0.4 |
| Tanzania | 6.4 | 6.8 | 0.4 |
| Uganda | 6.4 | 6.8 | 0.4 |
| Laos | 6.0 | 6.7 | 0.8 |
| Armenia | 6.2 | 6.6 | 0.4 |
| Sri Lanka | 6.2 | 6.6 | 0.4 |
| Uzbekistan | 5.7 | 6.3 | 0.6 |
| Rwanda | 6.0 | 6.3 | 0.2 |
| Cuba | 5.7 | 6.1 | 0.4 |
| Afghanistan | 5.1 | 5.6 | 0.4 |
| Tajikistan | 5.1 | 5.6 | 0.4 |
| Turkmenistan | 5.1 | 5.6 | 0.4 |
| Cambodia | 4.6 | 5.1 | 0.5 |
29Economies above 30% AI diffusionGlobal · Q1 2026 · page 2 · 1 row
Q1 2026.
Read source page · Open original PDF
| Measure | Value |
|---|---|
| Economies exceeding 30% of working-age population using AI | 26 |
30Global AI diffusion through Q1 2026Global · Q1 2026 · page 5 · 4 rows
Gap is percentage points, although the Q1 report prints percent signs. Q1 change compares Q1 2026 with H2 2025.
Read source page · Open original PDF
| Region | H1 2025 (%) | H2 2025 (%) | Q1 2026 (%) | Q1 change (pp) |
|---|---|---|---|---|
| Global North | 22.9 | 24.7 | 27.5 | 2.8 |
| Global South | 13.1 | 14.1 | 15.4 | 1.3 |
| World | 15.1 | 16.3 | 17.8 | 1.5 |
| North–South gap | 9.8 | 10.6 | 12.1 | — |
31Foundations for AI accessGlobal · Q1 2026 · page 5 · 2 rows
The report cites World Bank Population 2024, Our World in Data electricity access, ITU Internet use 2024 and ITU information/data-literacy skills. Different indicators and populations; do not interpret as a single conversion funnel.
Read source page · Open original PDF
| Region | AI user share (%) | Digital skills (%) | Internet access (%) | Electricity access (%) | Population baseline (%) |
|---|---|---|---|---|---|
| Global North | 27.5 | 70.1 | 90.1 | 98.1 | 100 |
| Global South | 15.4 | 48.2 | 65.7 | 88.9 | 100 |
32Fastest growing economies since June 2025Global · Q1 2026 · page 6 · 15 rows
Relative growth Q1 2026 versus H1 2025, as labeled in the chart; values may differ from ratios computed on rounded appendix values.
Read source page · Open original PDF
| Economy | Increase in AI user share (%) |
|---|---|
| South Korea | 43.2 |
| Thailand | 36.4 |
| Japan | 34.1 |
| Mongolia | 32.3 |
| Iran | 31.4 |
| Laos | 31.2 |
| Turkey | 30.3 |
| Belarus | 27.6 |
| El Salvador | 25.7 |
| Kazakhstan | 25.6 |
| Kyrgyzstan | 25.5 |
| Uzbekistan | 25.5 |
| Vietnam | 24.9 |
| Cambodia | 24.8 |
| Russia | 24.6 |
33Japan adoption and Japanese exam performanceGlobal · Q1 2026 · page 8 · 5 rows
Report narrative says 3.4pp growth is more than three times global average; its table reports global change 1.5 pp, so that narrative comparison is internally inconsistent. Exam endpoints summarize different cited studies rather than a harmonized series.
Read source page · Open original PDF
| Measure | Value | Unit |
|---|---|---|
| Japan rank H1 2025 | 56 | rank |
| Japan rank Q1 2026 | 48 | rank |
| Japan Q1 adoption increase | 3.4 | pp |
| Earlier Japanese professional-exam accuracy | 50.8 | % (approximately) |
| Recent Japanese professional-exam accuracy lower bound | 90 | % (over) |
34English and Japanese benchmark performanceGlobal · Q1 2026 · page 9 · 4 rows
Visually verified color mapping: English dark blue, Japanese light blue. MMLU and MMLU-Pro are different benchmarks and should be charted separately.
Read source page · Open original PDF
| Benchmark | Model | Release | English accuracy (%) | Japanese accuracy (%) |
|---|---|---|---|---|
| MMLU | GPT-3.5 Turbo | Mar 2023 | 70 | 50 |
| MMLU | GPT-4o | Aug 2024 | 89 | 80 |
| MMLU-Pro | GPT-4o | Aug 2024 | 69 | 75 |
| MMLU-Pro | GPT-5 | Aug 2025 | 85 | 87 |
35Year-over-year growth in Git pushesGlobal · Q1 2026 · page 9 · 2 rows
Source named by report: GitHub. Year-over-year growth during Q1 2026.
Read source page · Open original PDF
| Geography | Year-over-year growth (%) |
|---|---|
| Japan | 129 |
| Global | 78 |
36MMLU: English and Japanese accuracy (%)Global · Q1 2026 · page 9 · 2 rows
A separate benchmark; scores should not be compared across MMLU and MMLU-Pro. Duplicate numeric view of the combined benchmark table.
Read source page · Open original PDF
| Model | Release | English (%) | Japanese (%) |
|---|---|---|---|
| GPT-3.5 Turbo | Mar 2023 | 70 | 50 |
| GPT-4o | Aug 2024 | 89 | 80 |
37MMLU-Pro: English and Japanese accuracy (%)Global · Q1 2026 · page 9 · 2 rows
A separate benchmark; scores should not be compared across MMLU and MMLU-Pro. Duplicate numeric view of the combined benchmark table.
Read source page · Open original PDF
| Model | Release | English (%) | Japanese (%) |
|---|---|---|---|
| GPT-4o | Aug 2024 | 69 | 75 |
| GPT-5 | Aug 2025 | 85 | 87 |
38Global Git pushes: labeled endpointsGlobal · Q1 2026 · page 10 · 2 rows
Chart annotation reports +78% YoY. Unlabeled historical line is preserved in the source page; these are the only explicitly labeled values.
Read source page · Open original PDF
| Period | Git pushes (millions) |
|---|---|
| Q1 2025 | 213 |
| Q1 2026 | 380 |
39GPT-5.3-Codex benchmark claimsGlobal · Q1 2026 · page 10 · 2 rows
Approximately/around values in report prose; specific benchmark versions not provided in this paragraph.
Read source page · Open original PDF
| Benchmark | Accuracy (%) |
|---|---|
| Terminal-Bench | 77 |
| OSWorld | 65 |
40New GitHub repositories: labeled endpointsGlobal · Q1 2026 · page 11 · 2 rows
Chart annotation reports +45% YoY. Historical line is not numerically labeled.
Read source page · Open original PDF
| Period | New repositories (millions) |
|---|---|
| Q1 2025 | 14.7 |
| Q1 2026 | 21.3 |
41GitHub pull requests associated with AI agents: labeled endpointsGlobal · Q1 2026 · page 12 · 2 rows
Chart annotation reports 28× in 10 months. Narrative page 11 says since June 2025, conflicting with chart May 2025. The full historical line has no exact labels.
Read source page · Open original PDF
| Period | Agentic pull requests (millions) |
|---|---|
| May 2025 | 0.083 |
| Mar 2026 | 2.3 |
42US software developer employmentGlobal · Q1 2026 · page 12 · 3 rows
Reported from BLS CPS. These measures do not establish causal effects of AI on employment.
Read source page · Open original PDF
| Measure | Value | Unit | Period |
|---|---|---|---|
| Employment | 2.2 | million (approximately) | 2025 |
| Employment year-over-year growth | 8.5 | % | 2025 |
| Employment year-over-year growth | 4 | % (about) | March 2026 |
43Economy appendix, page 17Global · Q1 2026 · page 17 · 40 rows
Original report snapshot; compare with CSV vintages rather than silently overwriting prior values.
Read source page · Open original PDF
| Economy | H1 2025 (%) | H2 2025 (%) | Q1 2026 (%) | Q1 change (pp) |
|---|---|---|---|---|
| United Arab Emirates | 59.4 | 64.0 | 70.1 | 6.1 |
| Singapore | 58.6 | 60.9 | 63.4 | 2.5 |
| Norway | 45.3 | 46.4 | 48.6 | 2.2 |
| Ireland | 41.7 | 44.6 | 48.4 | 3.8 |
| France | 40.9 | 44.0 | 47.8 | 3.8 |
| Spain | 39.7 | 41.8 | 44.2 | 2.4 |
| New Zealand | 37.6 | 40.5 | 43.0 | 2.5 |
| United Kingdom | 36.4 | 38.9 | 42.2 | 3.3 |
| Netherlands | 36.3 | 38.9 | 42.1 | 3.2 |
| Qatar | 35.7 | 38.3 | 41.8 | 3.5 |
| Australia | 34.5 | 36.9 | 39.5 | 2.6 |
| Belgium | 33.5 | 36.0 | 39.0 | 3.0 |
| Israel | 33.9 | 36.1 | 38.1 | 2.0 |
| Switzerland | 32.4 | 34.8 | 37.8 | 3.0 |
| Canada | 33.5 | 35.0 | 37.3 | 2.3 |
| South Korea | 25.9 | 30.7 | 37.1 | 6.4 |
| Sweden | 31.2 | 33.3 | 36.1 | 2.8 |
| Austria | 29.1 | 31.4 | 34.1 | 2.7 |
| Hungary | 27.9 | 29.8 | 32.2 | 2.4 |
| Taiwan | 26.4 | 28.4 | 31.8 | 3.4 |
| United States | 26.3 | 28.3 | 31.3 | 3.0 |
| Denmark | 26.6 | 28.7 | 31.2 | 2.5 |
| Germany | 26.5 | 28.6 | 31.1 | 2.5 |
| Poland | 26.4 | 28.5 | 31.0 | 2.5 |
| Italy | 25.8 | 27.8 | 30.2 | 2.4 |
| Czech Republic | 26.0 | 27.8 | 30.1 | 2.3 |
| Jordan | 25.4 | 27.0 | 29.7 | 2.7 |
| Bulgaria | 25.4 | 27.3 | 29.7 | 2.4 |
| Finland | 25.6 | 27.3 | 29.5 | 2.2 |
| Saudi Arabia | 23.7 | 26.2 | 29.4 | 3.2 |
| Slovenia | 24.6 | 26.5 | 29.0 | 2.5 |
| Costa Rica | 25.1 | 26.5 | 28.5 | 2.0 |
| Lebanon | 24.8 | 25.7 | 27.3 | 1.6 |
| Vietnam | 21.2 | 23.5 | 26.5 | 3.0 |
| Oman | 22.6 | 24.2 | 26.5 | 2.3 |
| Portugal | 22.4 | 24.2 | 26.4 | 2.2 |
| Croatia | 21.8 | 23.7 | 26.1 | 2.4 |
| Slovak Republic | 22.1 | 23.8 | 26.1 | 2.3 |
| Dominican Republic | 22.0 | 22.7 | 24.8 | 2.1 |
| Uruguay | 20.9 | 22.5 | 24.6 | 2.1 |
44Economy appendix, page 18Global · Q1 2026 · page 18 · 40 rows
Original report snapshot; compare with CSV vintages rather than silently overwriting prior values.
Read source page · Open original PDF
| Economy | H1 2025 (%) | H2 2025 (%) | Q1 2026 (%) | Q1 change (pp) |
|---|---|---|---|---|
| Colombia | 20.4 | 22.0 | 24.5 | 2.5 |
| Lithuania | 21.0 | 22.4 | 24.3 | 1.9 |
| Serbia | 19.7 | 21.5 | 24.1 | 2.6 |
| Jamaica | 22.2 | 22.1 | 24.0 | 1.9 |
| Panama | 20.3 | 21.5 | 23.3 | 1.8 |
| South Africa | 19.3 | 21.1 | 23.1 | 2.0 |
| Chile | 19.6 | 20.8 | 22.7 | 1.9 |
| Japan | 16.7 | 19.1 | 22.5 | 3.4 |
| Bosnia And Herzegovina | 18.2 | 19.5 | 22.1 | 2.6 |
| Argentina | 17.8 | 19.6 | 21.9 | 2.3 |
| Malaysia | 18.3 | 19.7 | 21.8 | 2.1 |
| Kuwait | 17.7 | 19.1 | 21.1 | 2.0 |
| Greece | 17.7 | 19.1 | 20.8 | 1.7 |
| Georgia | 17.3 | 18.2 | 20.5 | 2.3 |
| Mexico | 16.7 | 17.8 | 20.1 | 2.3 |
| Philippines | 17.1 | 18.3 | 20.1 | 1.8 |
| Ecuador | 17.0 | 17.7 | 19.5 | 1.8 |
| Brazil | 15.6 | 17.1 | 19.1 | 2.0 |
| Albania | 15.8 | 16.5 | 18.5 | 2.0 |
| Moldova | 16.6 | 17.0 | 18.5 | 1.5 |
| El Salvador | 14.6 | 16.2 | 18.3 | 2.1 |
| Azerbaijan | 14.2 | 15.5 | 17.7 | 2.2 |
| India | 14.2 | 15.7 | 17.6 | 1.9 |
| Romania | 15.3 | 16.2 | 17.5 | 1.3 |
| Turkey | 13.4 | 14.6 | 17.4 | 2.8 |
| Mongolia | 12.6 | 14.3 | 16.7 | 2.4 |
| Guatemala | 13.7 | 14.8 | 16.4 | 1.6 |
| Peru | 13.4 | 14.7 | 16.4 | 1.7 |
| China | 15.4 | 16.3 | 16.4 | 0.1 |
| Kazakhstan | 12.7 | 13.7 | 15.9 | 2.2 |
| Namibia | 13.0 | 13.8 | 15.1 | 1.3 |
| Gabon | 12.3 | 13.4 | 15.0 | 1.6 |
| Libya | 12.7 | 13.7 | 15.0 | 1.3 |
| Egypt | 12.5 | 13.4 | 14.8 | 1.4 |
| Botswana | 12.8 | 13.7 | 14.8 | 1.1 |
| Nepal | 12.3 | 13.0 | 14.2 | 1.2 |
| Indonesia | 11.7 | 12.7 | 14.1 | 1.4 |
| Honduras | 12.4 | 13.1 | 14.0 | 0.9 |
| Senegal | 12.4 | 12.9 | 13.9 | 1.0 |
| Tunisia | 12.3 | 12.7 | 13.5 | 0.8 |
45Economy appendix, page 19Global · Q1 2026 · page 19 · 40 rows
Original report snapshot; compare with CSV vintages rather than silently overwriting prior values.
Read source page · Open original PDF
| Economy | H1 2025 (%) | H2 2025 (%) | Q1 2026 (%) | Q1 change (pp) |
|---|---|---|---|---|
| Algeria | 11.3 | 12.0 | 13.2 | 1.2 |
| Zambia | 11.7 | 12.3 | 13.1 | 0.8 |
| Cote D'Ivoire | 10.8 | 11.7 | 13.1 | 1.4 |
| Bolivia | 10.9 | 11.6 | 12.7 | 1.1 |
| Iran | 9.6 | 10.7 | 12.6 | 1.9 |
| Iraq | 10.3 | 11.2 | 12.5 | 1.3 |
| Thailand | 9.1 | 10.7 | 12.4 | 1.7 |
| Paraguay | 10.1 | 11.0 | 12.2 | 1.2 |
| Nicaragua | 10.0 | 10.7 | 11.8 | 1.1 |
| Morocco | 10.5 | 10.9 | 11.7 | 0.8 |
| Gambia | 10.6 | 10.9 | 11.4 | 0.5 |
| Pakistan | 9.7 | 10.3 | 11.4 | 1.1 |
| Angola | 8.9 | 9.7 | 10.9 | 1.2 |
| Madagascar | 8.9 | 9.7 | 10.9 | 1.2 |
| Malawi | 8.9 | 9.7 | 10.9 | 1.2 |
| Mozambique | 8.9 | 9.7 | 10.9 | 1.2 |
| French Guiana | 8.3 | 9.0 | 10.3 | 1.3 |
| Guyana | 8.3 | 9.0 | 10.3 | 1.3 |
| Suriname | 8.3 | 9.0 | 10.3 | 1.3 |
| Venezuela | 8.3 | 9.0 | 10.3 | 1.3 |
| Benin | 8.7 | 9.3 | 10.1 | 0.8 |
| Burkina Faso | 8.7 | 9.3 | 10.1 | 0.8 |
| Ghana | 8.7 | 9.3 | 10.1 | 0.8 |
| Guinea | 8.7 | 9.3 | 10.1 | 0.8 |
| Guinea-Bissau | 8.7 | 9.3 | 10.1 | 0.8 |
| Liberia | 8.7 | 9.3 | 10.1 | 0.8 |
| Mali | 8.7 | 9.3 | 10.1 | 0.8 |
| Mauritania | 8.7 | 9.3 | 10.1 | 0.8 |
| Niger | 8.7 | 9.3 | 10.1 | 0.8 |
| Nigeria | 8.7 | 9.3 | 10.1 | 0.8 |
| Sierra Leone | 8.7 | 9.3 | 10.1 | 0.8 |
| Togo | 8.7 | 9.3 | 10.1 | 0.8 |
| Myanmar | 8.4 | 9.1 | 10.0 | 0.9 |
| Lesotho | 8.8 | 9.1 | 9.8 | 0.7 |
| Belarus | 7.6 | 8.4 | 9.6 | 1.2 |
| Kyrgyzstan | 7.6 | 8.2 | 9.5 | 1.3 |
| Russia | 7.6 | 8.0 | 9.5 | 1.5 |
| Ukraine | 9.1 | 9.0 | 9.4 | 0.4 |
| Kenya | 7.8 | 8.1 | 8.7 | 0.6 |
| Cameroon | 7.0 | 7.8 | 8.7 | 0.9 |
46Economy appendix, page 20Global · Q1 2026 · page 20 · 27 rows
Original report snapshot; compare with CSV vintages rather than silently overwriting prior values.
Read source page · Open original PDF
| Economy | H1 2025 (%) | H2 2025 (%) | Q1 2026 (%) | Q1 change (pp) |
|---|---|---|---|---|
| Central African Republic | 7.0 | 7.8 | 8.7 | 0.9 |
| Chad | 7.0 | 7.8 | 8.7 | 0.9 |
| Congo | 7.0 | 7.8 | 8.7 | 0.9 |
| Democratic Republic Of The Congo | 7.0 | 7.8 | 8.7 | 0.9 |
| Zimbabwe | 6.9 | 7.6 | 8.5 | 0.9 |
| Haiti | 7.1 | 7.6 | 8.5 | 0.9 |
| Laos | 6.0 | 6.7 | 7.8 | 1.1 |
| Bangladesh | 6.5 | 7.1 | 7.8 | 0.7 |
| Papua New Guinea | 7.2 | 7.3 | 7.7 | 0.4 |
| Burundi | 6.4 | 6.8 | 7.6 | 0.8 |
| Eritrea | 6.4 | 6.8 | 7.6 | 0.8 |
| Ethiopia | 6.4 | 6.8 | 7.6 | 0.8 |
| Somalia | 6.4 | 6.8 | 7.6 | 0.8 |
| South Sudan | 6.4 | 6.8 | 7.6 | 0.8 |
| Sudan | 6.4 | 6.8 | 7.6 | 0.8 |
| Tanzania | 6.4 | 6.8 | 7.6 | 0.8 |
| Uganda | 6.4 | 6.8 | 7.6 | 0.8 |
| Syria | 6.7 | 7.1 | 7.5 | 0.4 |
| Armenia | 6.2 | 6.6 | 7.4 | 0.8 |
| Sri Lanka | 6.2 | 6.6 | 7.3 | 0.7 |
| Rwanda | 6.0 | 6.3 | 7.2 | 0.9 |
| Uzbekistan | 5.7 | 6.3 | 7.2 | 0.9 |
| Cuba | 5.7 | 6.1 | 6.7 | 0.6 |
| Afghanistan | 5.1 | 5.6 | 6.1 | 0.5 |
| Tajikistan | 5.1 | 5.6 | 6.1 | 0.5 |
| Turkmenistan | 5.1 | 5.6 | 6.1 | 0.5 |
| Cambodia | 4.6 | 5.1 | 5.7 | 0.6 |
47Global AI diffusion through Q2 2026Global · Q2 2026 · page 5 · 4 rows
Gap columns use percentage points. Measure covers ages 15–64; change compares Q2 with Q1.
Read source page · Open original PDF
| Region | H2 2025 (%) | Q1 2026 (%) | Q2 2026 (%) | Q2 change (pp) |
|---|---|---|---|---|
| Global North | 24.7 | 27.5 | 28.8 | 1.3 |
| Global South | 14.1 | 15.4 | 16.2 | 0.8 |
| World | 16.3 | 17.8 | 18.8 | 1.0 |
| North–South gap | 10.6 | 12.1 | 12.6 | — |
48Copilot intent prevalence relative to the global conversation mixGlobal · Q2 2026 · page 5 · 8 rows
Relative differences from each intent’s global share, not percentages of conversations or percentage-point gaps. Visually verified chart color mapping. Subset of consumer Copilot conversations; early adopters, not all AI users; intents ordered by global prevalence.
Read source page · Open original PDF
| Intent | Global North difference (%) | Global South difference (%) |
|---|---|---|
| Searching for information | 6.5 | -14.1 |
| Create/edit text or code | -10.3 | 22.4 |
| Feedback or advice | 12.6 | -27.5 |
| Shopping/product research | 16.9 | -36.9 |
| Self-directed learning | -13.4 | 29.2 |
| Create/edit images | -14.9 | 32.3 |
| Technical support | 3.8 | -8.3 |
| Schoolwork/academic support | -14.9 | 32.3 |
49Copilot traffic shares in the intent analysisGlobal · Q2 2026 · page 5 · 2 rows
Shares of the analyzed Copilot conversations; not population shares.
Read source page · Open original PDF
| Region | Traffic share (%) |
|---|---|
| Global North | 68.5 |
| Global South | 31.5 |
50OpenRouter open-weight token usageGlobal · Q2 2026 · page 7 · 2 rows
Late 2025 stated as roughly one-third, not a precise 33.3%. Analysis refers to >100 trillion tokens. OpenRouter is developer-oriented; excludes direct-provider and local usage and is not global market share.
Read source page · Open original PDF
| Period | Open-weight token share (%) |
|---|---|
| Late 2025 (roughly) | 33.333333333333336 |
| 2026 recent analysis | 75 |
51Artificial Analysis frontier labelsGlobal · Q2 2026 · page 7 · 2 rows
Explicit final labels in chart; full model release-date series is unlabeled. Inspect original page for exact visual context. Data through September 2026, beyond the Q2 adoption reporting period.
Read source page · Open original PDF
| Model class | Intelligence Index |
|---|---|
| Closed weights | 53.4 |
| Open weights | 44.9 |
52GLM 5.3 Flash cost compared with GPT 5.6 Sol highGlobal · Q2 2026 · page 8 · 1 row
Prose says similar intelligence performance at roughly one third the cost per task. Approximate ratio, not a direct measured price; full scatter values are unlabeled.
Read source page · Open original PDF
| Comparison | Relative cost |
|---|---|
| GLM 5.3 Flash / GPT 5.6 Sol high | 0.3333333333333333 |
53Hugging Face Spaces: labeled countsGlobal · Q2 2026 · page 9 · 3 rows
Chart and prose disagree on dates. Chart says 1.8× since first report; prose says approximately 83% increase. Projects are surviving Spaces, not distinct commercial products. All historical intermediate values are unlabeled.
Read source page · Open original PDF
| Period | Cumulative surviving Spaces |
|---|---|
| End 2023 (approximately) | 124000 |
| First report: chart Oct 2025 / prose Nov 2025 | 797000 |
| Chart Aug 2026 / prose Sep 2026 | 1460000 |
54Bring Your Own Language performance improvementGlobal · Q2 2026 · page 9 · 1 row
Report summary across a set of benchmarks, not exact per-language scores.
Read source page · Open original PDF
| Measure | Improvement (%) |
|---|---|
| Chichewa and Māori benchmark mean improvement (approximately) | 12 |
55Economy appendix, page 13Global · Q2 2026 · page 13 · 40 rows
Original report snapshot; compare with CSV vintages rather than silently overwriting prior values.
Read source page · Open original PDF
| Economy | Q1 2026 (%) | Q2 2026 (%) | Q2 change (pp) |
|---|---|---|---|
| United Arab Emirates | 70.1 | 73.3 | 3.2 |
| Singapore | 63.4 | 64.3 | 0.9 |
| Ireland | 48.4 | 49.9 | 1.5 |
| France | 47.8 | 49.6 | 1.8 |
| Norway | 48.6 | 49.4 | 0.8 |
| Spain | 44.2 | 45.1 | 0.9 |
| New Zealand | 43.0 | 44.1 | 1.1 |
| United Kingdom | 42.2 | 43.7 | 1.5 |
| Netherlands | 42.1 | 43.5 | 1.4 |
| Qatar | 41.8 | 43.5 | 1.7 |
| Australia | 39.5 | 40.7 | 1.2 |
| South Korea | 37.1 | 40.6 | 3.5 |
| Belgium | 39.0 | 40.3 | 1.3 |
| Switzerland | 37.8 | 39.1 | 1.3 |
| Israel | 38.1 | 38.7 | 0.6 |
| Canada | 37.3 | 38.5 | 1.2 |
| Sweden | 36.1 | 37.3 | 1.2 |
| Austria | 34.1 | 35.4 | 1.3 |
| Taiwan | 31.8 | 33.8 | 2.0 |
| Hungary | 32.2 | 33.3 | 1.1 |
| United States | 31.3 | 33.0 | 1.7 |
| Denmark | 31.2 | 32.4 | 1.2 |
| Germany | 31.1 | 32.3 | 1.2 |
| Poland | 31.0 | 32.3 | 1.3 |
| Saudi Arabia | 29.4 | 31.4 | 2.0 |
| Italy | 30.2 | 31.4 | 1.2 |
| Czech Republic | 30.1 | 31.2 | 1.1 |
| Jordan | 29.7 | 31.2 | 1.5 |
| Bulgaria | 29.7 | 30.7 | 1.0 |
| Finland | 29.5 | 30.6 | 1.1 |
| Slovenia | 29.0 | 30.1 | 1.1 |
| Costa Rica | 28.5 | 29.7 | 1.2 |
| Vietnam | 26.5 | 27.9 | 1.4 |
| Lebanon | 27.3 | 27.7 | 0.4 |
| Oman | 26.5 | 27.6 | 1.1 |
| Portugal | 26.4 | 27.4 | 1.0 |
| Croatia | 26.1 | 27.2 | 1.1 |
| Slovak Republic | 26.1 | 27.1 | 1.0 |
| Colombia | 24.5 | 25.9 | 1.4 |
| Dominican Republic | 24.8 | 25.8 | 1.0 |
56Economy appendix, page 14Global · Q2 2026 · page 14 · 40 rows
Original report snapshot; compare with CSV vintages rather than silently overwriting prior values.
Read source page · Open original PDF
| Economy | Q1 2026 (%) | Q2 2026 (%) | Q2 change (pp) |
|---|---|---|---|
| Uruguay | 24.6 | 25.7 | 1.1 |
| Serbia | 24.1 | 25.3 | 1.2 |
| Lithuania | 24.3 | 25.1 | 0.8 |
| Jamaica | 24.0 | 25.0 | 1.0 |
| Japan | 22.5 | 24.7 | 2.2 |
| Panama | 23.3 | 24.2 | 0.9 |
| Chile | 22.7 | 24.0 | 1.3 |
| South Africa | 23.1 | 23.9 | 0.8 |
| Argentina | 21.9 | 23.4 | 1.5 |
| Bosnia And Herzegovina | 22.1 | 23.2 | 1.1 |
| Malaysia | 21.8 | 22.6 | 0.8 |
| Kuwait | 21.1 | 22.6 | 1.5 |
| Georgia | 20.5 | 21.6 | 1.1 |
| Greece | 20.8 | 21.5 | 0.7 |
| Mexico | 20.1 | 21.4 | 1.3 |
| Philippines | 20.1 | 20.7 | 0.6 |
| Ecuador | 19.5 | 20.3 | 0.8 |
| Brazil | 19.1 | 20.2 | 1.1 |
| El Salvador | 18.3 | 20.1 | 1.8 |
| Albania | 18.5 | 19.2 | 0.7 |
| Moldova | 18.5 | 19.1 | 0.6 |
| Turkey | 17.4 | 18.9 | 1.5 |
| Azerbaijan | 17.7 | 18.7 | 1.0 |
| India | 17.6 | 18.5 | 0.9 |
| Romania | 17.5 | 18.0 | 0.5 |
| Mongolia | 16.7 | 17.9 | 1.2 |
| China | 16.4 | 17.5 | 1.1 |
| Peru | 16.4 | 17.3 | 0.9 |
| Guatemala | 16.4 | 17.3 | 0.9 |
| Kazakhstan | 15.9 | 16.9 | 1.0 |
| Gabon | 15.0 | 15.7 | 0.7 |
| Libya | 15.0 | 15.5 | 0.5 |
| Egypt | 14.8 | 15.5 | 0.7 |
| Namibia | 15.1 | 15.4 | 0.3 |
| Botswana | 14.8 | 15.0 | 0.2 |
| Indonesia | 14.1 | 14.8 | 0.7 |
| Nepal | 14.2 | 14.6 | 0.4 |
| Honduras | 14.0 | 14.5 | 0.5 |
| Senegal | 13.9 | 14.4 | 0.5 |
| Tunisia | 13.5 | 13.9 | 0.4 |
57Economy appendix, page 15Global · Q2 2026 · page 15 · 40 rows
Original report snapshot; compare with CSV vintages rather than silently overwriting prior values.
Read source page · Open original PDF
| Economy | Q1 2026 (%) | Q2 2026 (%) | Q2 change (pp) |
|---|---|---|---|
| Algeria | 13.3 | 13.8 | 0.5 |
| Cote D'Ivoire | 13.1 | 13.7 | 0.6 |
| Thailand | 12.4 | 13.4 | 1.0 |
| Bolivia | 12.7 | 13.3 | 0.6 |
| Zambia | 13.1 | 13.3 | 0.2 |
| Iraq | 12.5 | 13.0 | 0.5 |
| Iran | 12.6 | 12.8 | 0.2 |
| Paraguay | 12.2 | 12.6 | 0.4 |
| Nicaragua | 11.8 | 12.5 | 0.7 |
| Morocco | 11.7 | 12.0 | 0.3 |
| Pakistan | 11.4 | 11.9 | 0.5 |
| Gambia | 11.5 | 11.5 | 0.0 |
| Mozambique | 10.9 | 11.4 | 0.5 |
| Angola | 10.9 | 11.4 | 0.5 |
| Madagascar | 10.9 | 11.4 | 0.5 |
| Malawi | 10.9 | 11.4 | 0.5 |
| Guyana | 10.3 | 11.3 | 1.0 |
| Suriname | 10.3 | 11.3 | 1.0 |
| Venezuela | 10.3 | 11.3 | 1.0 |
| French Guiana | 10.3 | 11.3 | 1.0 |
| Myanmar | 10.0 | 10.4 | 0.4 |
| Togo | 10.1 | 10.4 | 0.3 |
| Guinea | 10.1 | 10.4 | 0.3 |
| Niger | 10.1 | 10.4 | 0.3 |
| Liberia | 10.1 | 10.4 | 0.3 |
| Nigeria | 10.1 | 10.4 | 0.3 |
| Benin | 10.1 | 10.4 | 0.3 |
| Mali | 10.1 | 10.4 | 0.3 |
| Ghana | 10.1 | 10.4 | 0.3 |
| Guinea-Bissau | 10.1 | 10.4 | 0.3 |
| Sierra Leone | 10.1 | 10.4 | 0.3 |
| Mauritania | 10.1 | 10.4 | 0.3 |
| Burkina Faso | 10.1 | 10.4 | 0.3 |
| Belarus | 9.6 | 10.3 | 0.7 |
| Kyrgyzstan | 9.5 | 10.0 | 0.5 |
| Russia | 9.5 | 9.9 | 0.4 |
| Lesotho | 9.8 | 9.9 | 0.1 |
| Ukraine | 9.5 | 9.5 | 0.0 |
| Chad | 8.7 | 9.1 | 0.4 |
| Central African Republic | 8.7 | 9.1 | 0.4 |
58Economy appendix, page 16Global · Q2 2026 · page 16 · 27 rows
Original report snapshot; compare with CSV vintages rather than silently overwriting prior values.
Read source page · Open original PDF
| Economy | Q1 2026 (%) | Q2 2026 (%) | Q2 change (pp) |
|---|---|---|---|
| Cameroon | 8.7 | 9.1 | 0.4 |
| Democratic Republic Of The Congo | 8.7 | 9.1 | 0.4 |
| Congo | 8.7 | 9.1 | 0.4 |
| Haiti | 8.5 | 8.9 | 0.4 |
| Kenya | 8.7 | 8.9 | 0.2 |
| Zimbabwe | 8.5 | 8.9 | 0.4 |
| Laos | 7.8 | 8.4 | 0.6 |
| Bangladesh | 7.8 | 8.0 | 0.2 |
| Uganda | 7.6 | 8.0 | 0.4 |
| Ethiopia | 7.6 | 8.0 | 0.4 |
| Somalia | 7.6 | 8.0 | 0.4 |
| Eritrea | 7.6 | 8.0 | 0.4 |
| South Sudan | 7.6 | 8.0 | 0.4 |
| Sudan | 7.6 | 8.0 | 0.4 |
| Burundi | 7.6 | 8.0 | 0.4 |
| Tanzania | 7.6 | 8.0 | 0.4 |
| Armenia | 7.4 | 7.7 | 0.3 |
| Papua New Guinea | 7.7 | 7.6 | -0.1 |
| Sri Lanka | 7.3 | 7.6 | 0.3 |
| Rwanda | 7.2 | 7.6 | 0.4 |
| Uzbekistan | 7.2 | 7.6 | 0.4 |
| Syria | 7.5 | 7.4 | -0.1 |
| Cuba | 6.7 | 6.8 | 0.1 |
| Tajikistan | 6.1 | 6.3 | 0.2 |
| Afghanistan | 6.1 | 6.3 | 0.2 |
| Turkmenistan | 6.1 | 6.3 | 0.2 |
| Cambodia | 5.8 | 6.1 | 0.3 |
59College-age population and AI adoptionUnited States · Q1 2026 · page 2 · 2 rows
Narrative comparison; report does not specify weighting in this paragraph.
Read source page · Open original PDF
| County population share ages 18–24 | Average AI user share (%) |
|---|---|
| More than 10% | 28.6 |
| Smaller shares | 20.3 |
60AI adoption by county urbanization classUnited States · Q1 2026 · page 5 · 3 rows
Report classifications: metropolitan generally urban core ≥50,000; micropolitan 5,000–50,000; rural outside both. Population proportions rounded.
Read source page · Open original PDF
| County class | AI user share (%) | Share of population (%) |
|---|---|---|
| Metropolitan | 32.9 | 87 |
| Micropolitan | 21.8 | 10 |
| Rural | 16.2 | 3 |
61Urbanization and trustUnited States · Q1 2026 · page 5 · 3 rows
The 0.17 is an association, not causation. Trust percentages come from National AI Opinion Monitor survey cited in report, not Microsoft telemetry.
Read source page · Open original PDF
| Measure | Value | Unit |
|---|---|---|
| AI user share per 1% more urban population | 0.17 | pp |
| Urban respondents: AI likely acts in public interest | 53 | % |
| Rural respondents: AI likely acts in public interest | 38 | % |
62Top 15 counties by AI user share, minimum 10,000 populationUnited States · Q1 2026 · page 7 · 15 rows
13 of 15 exceed 95th percentile of young-adult share nationally, per prose. Population cutoff matters: this is not the unrestricted ranking of all CSV counties.
Read source page · Open original PDF
| Rank | County-equivalent area | State | Age 18–24 share (%) | AI user share (%) | Anchor institution |
|---|---|---|---|---|---|
| 1 | Williamsburg | Virginia | 36.2 | 73.2 | College of William & Mary |
| 2 | Harrisonburg | Virginia | 32.7 | 67.5 | James Madison University |
| 3 | Madison | Idaho | 46.4 | 67.2 | Brigham Young University-Idaho |
| 4 | Brazos | Texas | 26.4 | 64 | Texas A&M University |
| 5 | Story | Iowa | 30.6 | 63.8 | Iowa State University |
| 6 | Denton | Texas | 8.9 | 60.1 | University of North Texas |
| 7 | Clarke | Georgia | 26 | 59 | University of Georgia |
| 8 | Douglas | Kansas | 23 | 57.2 | University of Kansas |
| 9 | Charlottesville | Virginia | 20.1 | 51.7 | University of Virginia |
| 10 | Cleveland | Oklahoma | 15 | 51.6 | University of Oklahoma |
| 11 | Hays | Texas | 14.2 | 51.4 | Texas State University |
| 12 | Lee | Alabama | 16.5 | 50.8 | Auburn University |
| 13 | Montgomery | Virginia | 27.8 | 50.8 | Virginia Tech |
| 14 | Utah | Utah | 16.8 | 50.2 | Brigham Young University |
| 15 | Fredericksburg | Virginia | 18 | 49.3 | University of Mary Washington |
63Top-county contextUnited States · Q1 2026 · page 7 · 3 rows
Top 15 ranking applies to counties with at least 10,000 residents.
Read source page · Open original PDF
| Measure | Value | Unit |
|---|---|---|
| Top 15 counties with a college or university | 15 | count |
| Top 15 above 95th percentile in age 18–24 share | 13 | count |
| Denton technology-access national rank | 12 | rank |
6435 largest metropolitan areasUnited States · Q1 2026 · page 8 · 35 rows
Prose selection criterion is working-age population above 1.5 million. Figure caption merely says population > 1.5 million; preserve the more explicit prose definition.
Read source page · Open original PDF
| Rank | Metro | States | AI user share (%) |
|---|---|---|---|
| 1 | Washington | DC, VA, MD, WV | 39.7 |
| 2 | Dallas | TX | 39.4 |
| 3 | Miami | FL | 38.6 |
| 4 | Houston | TX | 38.4 |
| 5 | Atlanta | GA | 38.0 |
| 6 | San Francisco | CA | 38.0 |
| 7 | Austin | TX | 37.8 |
| 8 | Seattle | WA | 36.8 |
| 9 | Chicago | IL, IN | 36.6 |
| 10 | Las Vegas | NV | 36.5 |
| 11 | San Diego | CA | 36.3 |
| 12 | Orlando | FL | 36.2 |
| 13 | San Antonio | TX | 35.4 |
| 14 | New York | NY, NJ | 35.2 |
| 15 | Boston | MA, NH | 35.1 |
| 16 | Riverside | CA | 35.1 |
| 17 | Nashville | TN | 34.7 |
| 18 | Los Angeles | CA | 34.7 |
| 19 | Tampa | FL | 33.8 |
| 20 | Baltimore | MD | 33.7 |
| 21 | Charlotte | NC, SC | 33.6 |
| 22 | Phoenix | AZ | 33.4 |
| 23 | Cincinnati | OH, KY, IN | 32.9 |
| 24 | Denver | CO | 32.8 |
| 25 | Philadelphia | PA, NJ, DE, MD | 32.6 |
| 26 | Kansas City | MO, KS | 32.4 |
| 27 | Portland | OR, WA | 31.1 |
| 28 | Sacramento | CA | 29.6 |
| 29 | Minneapolis | MN, WI | 29.2 |
| 30 | Cleveland | OH | 29.1 |
| 31 | Detroit | MI | 29.1 |
| 32 | Indianapolis | IN | 28.8 |
| 33 | Columbus | OH | 28.7 |
| 34 | St. Louis | MO, IL | 26.8 |
| 35 | Pittsburgh | PA | 25.8 |
65State AI diffusion rankingUnited States · Q1 2026 · page 13 · 50 rows
50 states; Washington DC is not a state and excluded.
Read source page · Open original PDF
| Rank | State | AI user share (%) |
|---|---|---|
| 1 | Maryland | 36.3 |
| 2 | Utah | 35.7 |
| 3 | Texas | 35.3 |
| 4 | Virginia | 34.7 |
| 5 | New Jersey | 34.5 |
| 6 | Nevada | 34.2 |
| 7 | California | 34.0 |
| 8 | Connecticut | 34.0 |
| 9 | Georgia | 33.7 |
| 10 | Florida | 33.6 |
| 11 | Massachusetts | 33.4 |
| 12 | Illinois | 33.3 |
| 13 | New York | 32.7 |
| 14 | Rhode Island | 32.5 |
| 15 | Colorado | 32.3 |
| 16 | Washington | 32.2 |
| 17 | Arizona | 31.4 |
| 18 | Hawaii | 30.6 |
| 19 | Delaware | 30.6 |
| 20 | New Hampshire | 30.2 |
| 21 | North Carolina | 30.1 |
| 22 | South Carolina | 29.1 |
| 23 | Oklahoma | 28.9 |
| 24 | Idaho | 28.8 |
| 25 | Kansas | 28.6 |
| 26 | Tennessee | 28.5 |
| 27 | Oregon | 28.4 |
| 28 | Ohio | 28.3 |
| 29 | Wisconsin | 28.2 |
| 30 | North Dakota | 28.2 |
| 31 | Michigan | 27.4 |
| 32 | South Dakota | 27.4 |
| 33 | Alabama | 27.3 |
| 34 | Pennsylvania | 27.2 |
| 35 | Indiana | 26.8 |
| 36 | Missouri | 26.8 |
| 37 | Nebraska | 26.4 |
| 38 | Minnesota | 26.3 |
| 39 | Louisiana | 26.1 |
| 40 | Arkansas | 26.0 |
| 41 | Wyoming | 25.5 |
| 42 | Kentucky | 25.1 |
| 43 | Iowa | 24.4 |
| 44 | New Mexico | 23.9 |
| 45 | Alaska | 23.6 |
| 46 | Vermont | 23.3 |
| 47 | Mississippi | 22.9 |
| 48 | Montana | 22.7 |
| 49 | Maine | 21.4 |
| 50 | West Virginia | 20.8 |
No matching records. Try another term or clear the edition filter.
23 original charts without exact point-level data
These graphics remain available in the reader. No values have been estimated from curves, map colours or pixel heights.
- Real GDP per capita: Philippines vs. South Korea
Annual curves, 1960s–2020s; no exact datapoint labels or underlying series in folder.
Global · H1 2025 · page 4 · Read source page
- Household diffusion of AI and earlier technologies
Six curves (AI, smartphone, cellphone, radio, internet, electricity), percent of U.S. households against years since introduction; no exact datapoint labels.
Global · H1 2025 · page 5 · Read source page
- AI diffusion and GDP
Country scatter against GDP per capita (USD) 2023. Diffusion values are in appendix; GDP coordinates are not printed.
Global · H1 2025 · page 6 · Read source page
- Access to electricity by economy
Choropleth bins: >80%, 60–80%, 40–60%, 20–40%, 0–20%, no data. Exact economy shares absent.
Global · H1 2025 · page 8 · Read source page
- Where AI data center regions are located
Bubble map, legend counts 1/10/20/30; individual region counts not printed.
Global · H1 2025 · page 9 · Read source page
- Internet connectivity by economy
Choropleth bins 0–20%, 20–40%, 40–60%, 60–80%, 80–100%, no data; exact country shares absent.
Global · H1 2025 · page 10 · Read source page
- Global digital adoption by economy
World Bank Digital Adoption Index choropleth with 20-point bins; exact country values absent.
Global · H1 2025 · page 11 · Read source page
- Open web content by language
Language treemap / Voronoi-style cells with labels but no numerical shares. Only narrative English 50% is recoverable.
Global · H1 2025 · page 12 · Read source page
- Language coverage in AI resources
Categorical country map: high, intermediate, low, no data. No numerical scale.
Global · H1 2025 · page 13 · Read source page
- AI models by performance, cost, and release date
Bubble plot; exact intelligence scores, dates and price values not printed. Model names printed only for selected points.
Global · H1 2025 · page 15 · Read source page
- AI user base growth H1 2025 to H2 2025
Only South Korea bar has country/value labels (81.4%). Grey bars have neither country labels nor exact values. Period title conflicts with adjoining since-October-2024 prose.
Global · H2 2025 · page 7 · Read source page
- DeepSeek market share by economy
Four exact country labels extracted. Remaining economies appear only as colour bins; not numerically recoverable from folder.
Global · H2 2025 · page 10 · Read source page
- English MMLU versus14-language MMMLU over time
Model/date points and values are not explicitly labeled. All chart marks preserved in source page; no fabricated numeric series.
Global · Q1 2026 · page 7 · Read source page
- Japan and world monthly adoption, three-month average
Monthly values and annotated model-release dates are not tabulated. Period-aggregate country CSV cannot reproduce monthly curve.
Global · Q1 2026 · page 8 · Read source page
- Historical global Git pushes
OnlyQ1 2025 andQ1 2026 endpoints labeled; intermediate monthly counts not provided.
Global · Q1 2026 · page 10 · Read source page
- Historical new GitHub repositories
OnlyQ1 2025 andQ1 2026 endpoints labeled; intermediate counts not provided.
Global · Q1 2026 · page 11 · Read source page
- Historical GitHub pull requests associated with AI agents
OnlyMay 2025 andMarch 2026 endpoints labeled; intermediate counts not provided.
Global · Q1 2026 · page 12 · Read source page
- Artificial Analysis Intelligence Index by model release date
Individual model points and frontier progression not numerically labeled; only 53.4 / 44.9 endpoint labels.
Global · Q2 2026 · page 7 · Read source page
- Artificial Analysis intelligence vs cost per task
Named points shown, but exact per-model costs and intelligence scores not labeled. Axes alone cannot establish exact values.
Global · Q2 2026 · page 8 · Read source page
- Hugging Face surviving Spaces historical trajectory
Three narrative/annotation counts extracted; all other trajectory values unlabeled.
Global · Q2 2026 · page 9 · Read source page
- County AI share vs urban population share
County AI share exists in CSV; urban shares and populations do not. Cannot faithfully reconstruct scatter from supplied tables.
United States · Q1 2026 · page 5 · Read source page
- County AI share vs young-adult population share
County AI share exists in CSV; age 18–24shares exist only for top 15table. Cannot reconstruct full scatter.
United States · Q1 2026 · page 6 · Read source page
- Industry composition and AI usage estimates and95% confidence intervals
14 industry point estimates and confidence-interval endpoints shown graphically without numeric labels. Positive categories: professional/technical services, services overall, headquarters/management, health care, information/media, finance, wholesale. Near-zero: education, utilities. Negative: manufacturing, agriculture, mining/oil/gas, construction, goods-producing. Do not infer precise coefficients from pixels.
United States · Q1 2026 · page 9 · Read source page
US college guidance and preparation · September 2026
| Statement | Share | Item sample |
|---|---|---|
| Mostly developed AI skills independently, outside formal coursework | 79.3% | 1,003 |
| Professors and courses provided meaningful guidance on effective and ethical AI use | 68.1% | 1,003 |
| Institution adequately prepares students for AI use in their future career | 49.5% | 1,003 |
Separate, overlapping agreement measures, not complements or an adoption rate. Weighted online-panel self-reports; working paper, peer review not verified. Design effects were not verified. No causal learning outcomes or direct comparison with HEPI. Dartmouth working paper, Table 12 (PDF p. 22) · Source and methods. The 65 Microsoft transcription records and five-report reader below retain their original scope.
UK business AI · 2026
| Business size | AI use | Unweighted base |
|---|---|---|
| All eligible businesses | 32% | 3,503 |
| Micro · 5–9 employees | 27% | 1,347 |
| Small · 10–49 employees | 34% | 1,579 |
| Medium · 50–249 employees | 47% | 447 |
| Large · 250+ employees | 52% | 130 |
Skills barrier among nonusers planning adoption: 78% (unweighted n=236). Broad AI, including pilots, not only generative AI. Selected sectors and a five-employee threshold differ from Eurostat; no direct UK–EU ranking. Self-reports, not a census or causal productivity evidence. Low response creates nonresponse risk; weighting does not establish its absence. Methods and source qualifications · Six observations · CSV · Original government tables.
Reuters Institute · use and search exposure
| Measure | Wave | Share | Respondents |
|---|---|---|---|
| Weekly use of standalone generative AI tools — six countries | 2025 | 34% | 12,565 |
| Weekly use of standalone generative AI tools — six countries | 2026 | 51% | 12,774 |
| AI-generated answers or assistants encountered in search engines in the previous week — nine countries | 2026 | 57% | 18,921 |
Self-reported use and exposure, subject to recall and interpretation; online samples underrepresent people offline. No conventional sampling margin of error; not a worldwide estimate or directly comparable with Microsoft usage estimates. Different country sets and questions mean the weekly-use and search-exposure figures must not be subtracted as an exposure gap. Weekly-use comparison covers the same six countries, not a longitudinal panel. The prompted standalone-tool list changed from 13 tools in 2025 to 14 in 2026; this qualification accompanies the trend. Methods and source qualifications · Three observations · CSV.
OECD · regional enterprise adoption
In the selected 2025 data, the simple average regional share of enterprises using AI was 11.43% across 43 Central and Eastern European regions, compared with 26.10% across 48 other covered regions. These are unweighted means of regional rates across 12 countries, not enterprise-weighted adoption rates for Europe.
OECD analysis of existing Eurostat isoc_r_eb_ain2 data, not an independent survey. Selected 2025 regional coverage in 12 countries; not Europe-wide. Regional achieved sample counts and confidence intervals are not supplied in the workbook. Employment exposure in column D is excluded: it has a different denominator.
| Country | Region | Code | AI use | OECD grouping |
|---|---|---|---|---|
| Austria | Burgenland | AT11 | 18.33% | North, South & West Europe |
| Austria | Carinthia | AT21 | 23.63% | North, South & West Europe |
| Austria | Lower Austria | AT12 | 21.81% | North, South & West Europe |
| Austria | Salzburg | AT32 | 31.45% | North, South & West Europe |
| Austria | Styria | AT22 | 25.55% | North, South & West Europe |
| Austria | Tyrol | AT33 | 30.28% | North, South & West Europe |
| Austria | Upper Austria | AT31 | 32.93% | North, South & West Europe |
| Austria | Vienna | AT13 | 37.36% | North, South & West Europe |
| Austria | Vorarlberg | AT34 | 36.42% | North, South & West Europe |
| Belgium | Brussels Capital Region | BE1 | 42.32% | North, South & West Europe |
| Belgium | Flemish Region | BE2 | 34.84% | North, South & West Europe |
| Belgium | Walloon Region | BE3 | 30.20% | North, South & West Europe |
| Croatia | Adriatic Croatia | HR03 | 10.98% | East Europe |
| Croatia | City of Zagreb | HR05 | 25.44% | East Europe |
| Croatia | Northern Croatia | HR06 | 11.98% | East Europe |
| Croatia | Pannonian Croatia | HR02 | 10.51% | East Europe |
| Czechia | Central Bohemian Region | CZ02 | 13.47% | East Europe |
| Czechia | Central Moravia | CZ07 | 15.57% | East Europe |
| Czechia | Moravia-Silesia | CZ08 | 15.72% | East Europe |
| Czechia | Northeast | CZ05 | 17.81% | East Europe |
| Czechia | Northwest | CZ04 | 9.47% | East Europe |
| Czechia | Prague | CZ01 | 25.50% | East Europe |
| Czechia | Southeast | CZ06 | 15.49% | East Europe |
| Czechia | Southwest | CZ03 | 14.06% | East Europe |
| Denmark | Central Jutland | DK04 | 50.82% | North, South & West Europe |
| Denmark | Copenhagen region | DK01 | 33.05% | North, South & West Europe |
| Denmark | Northern Jutland | DK05 | 32.13% | North, South & West Europe |
| Denmark | Southern Denmark | DK03 | 34.68% | North, South & West Europe |
| Denmark | Zealand | DK02 | 42.73% | North, South & West Europe |
| Hungary | Budapest | HU11 | 17.66% | East Europe |
| Hungary | Central Transdanubia | HU21 | 7.72% | East Europe |
| Hungary | Northern Great Plain | HU32 | 5.48% | East Europe |
| Hungary | Northern Hungary | HU31 | 6.26% | East Europe |
| Hungary | Pest | HU12 | 7.40% | East Europe |
| Hungary | Southern Great Plain | HU33 | 7.07% | East Europe |
| Hungary | Southern Transdanubia | HU23 | 7.98% | East Europe |
| Hungary | Western Transdanubia | HU22 | 6.11% | East Europe |
| Lithuania | Central and Western Lithuania | LT02 | 17.98% | East Europe |
| Lithuania | Vilnius Region | LT01 | 26.84% | East Europe |
| Norway | Agder and Sør-Østlandet | NO09 | 24.22% | North, South & West Europe |
| Norway | Innlandet | NO02 | 23.64% | North, South & West Europe |
| Norway | Northern Norway | NO07 | 20.38% | North, South & West Europe |
| Norway | Oslo and Viken | NO08 | 35.49% | North, South & West Europe |
| Norway | Trøndelag | NO06 | 27.18% | North, South & West Europe |
| Norway | Western Norway | NO0A | 25.56% | North, South & West Europe |
| Poland | Greater Poland | PL41 | 7.50% | East Europe |
| Poland | Kuyavian-Pomerania | PL61 | 6.36% | East Europe |
| Poland | Lesser Poland | PL21 | 8.86% | East Europe |
| Poland | Lodzkie | PL71 | 7.57% | East Europe |
| Poland | Lower Silesia | PL51 | 9.68% | East Europe |
| Poland | Lublin Province | PL81 | 5.86% | East Europe |
| Poland | Lubusz | PL43 | 5.58% | East Europe |
| Poland | Mazowiecki region | PL92 | 2.94% | East Europe |
| Poland | Opole region | PL52 | 7.40% | East Europe |
| Poland | Podkarpacia | PL82 | 7.02% | East Europe |
| Poland | Podlaskie | PL84 | 5.56% | East Europe |
| Poland | Pomerania | PL63 | 9.24% | East Europe |
| Poland | Silesia | PL22 | 8.05% | East Europe |
| Poland | Swietokrzyskie | PL72 | 5.31% | East Europe |
| Poland | Warmian-Masuria | PL62 | 4.53% | East Europe |
| Poland | Warsaw | PL91 | 15.99% | East Europe |
| Poland | West Pomerania | PL42 | 7.92% | East Europe |
| Slovak Republic | Bratislava Region | SK01 | 28.36% | East Europe |
| Slovak Republic | Central Slovakia | SK03 | 14.00% | East Europe |
| Slovak Republic | East Slovakia | SK04 | 13.36% | East Europe |
| Slovak Republic | West Slovakia | SK02 | 14.00% | East Europe |
| Spain | Andalusia | ES61 | 15.83% | North, South & West Europe |
| Spain | Aragon | ES24 | 12.68% | North, South & West Europe |
| Spain | Asturias | ES12 | 15.08% | North, South & West Europe |
| Spain | Balearic Islands | ES53 | 11.87% | North, South & West Europe |
| Spain | Basque Country | ES21 | 22.42% | North, South & West Europe |
| Spain | Canary Islands | ES70 | 15.85% | North, South & West Europe |
| Spain | Cantabria | ES13 | 10.99% | North, South & West Europe |
| Spain | Castile and León | ES41 | 17.13% | North, South & West Europe |
| Spain | Castile-La Mancha | ES42 | 18.93% | North, South & West Europe |
| Spain | Catalonia | ES51 | 24.04% | North, South & West Europe |
| Spain | Extremadura | ES43 | 14.88% | North, South & West Europe |
| Spain | Galicia | ES11 | 17.06% | North, South & West Europe |
| Spain | La Rioja | ES23 | 14.61% | North, South & West Europe |
| Spain | Madrid | ES30 | 27.42% | North, South & West Europe |
| Spain | Murcia | ES62 | 15.09% | North, South & West Europe |
| Spain | Navarra | ES22 | 20.35% | North, South & West Europe |
| Spain | Valencia | ES52 | 19.82% | North, South & West Europe |
| Sweden | Central Norrland | SE32 | 18.43% | North, South & West Europe |
| Sweden | East Middle Sweden | SE12 | 29.23% | North, South & West Europe |
| Sweden | North Middle Sweden | SE31 | 22.09% | North, South & West Europe |
| Sweden | Småland with Islands | SE21 | 29.53% | North, South & West Europe |
| Sweden | South Sweden | SE22 | 31.32% | North, South & West Europe |
| Sweden | Stockholm | SE11 | 44.77% | North, South & West Europe |
| Sweden | Upper Norrland | SE33 | 31.51% | North, South & West Europe |
| Sweden | West Sweden | SE23 | 37.08% | North, South & West Europe |
Regional values · CSV · Data and provenance · JSON · OECD workbook ↗ · Methods and coverage
OECD / Technology combinations
Using AI alongside cloud and analytics.
Around 12% is the unweighted mean across 28 covered OECD countries for enterprises with at least ten employees using all three technologies. It measures co-use; it does not establish successful workflow integration or returns.
Published mean and 28 country rates (displayed to four decimals)
| Country | Reference period | AI + cloud + analytics (%) |
|---|---|---|
| OECD | 2025 or most recent (2021–2025) | 12.2162 |
| Australia (2022) | 2021–2022 | 1.4000 |
| Austria | 2025 | 11.1124 |
| Belgium | 2025 | 22.7793 |
| Canada (2023) | 2023 | 1.8000 |
| Czech Republic | 2025 | 11.0392 |
| Denmark | 2025 | 29.9112 |
| Estonia | 2025 | 16.1476 |
| Finland | 2025 | 25.4826 |
| France | 2025 | 8.3080 |
| Germany | 2025 | 12.9291 |
| Greece | 2025 | 4.6703 |
| Hungary | 2025 | 5.7149 |
| Ireland | 2025 | 13.4635 |
| Italy | 2025 | 10.1717 |
| Japan (2023) | 2021–2023 | 2.9417 |
| Korea (2024) | 2024 | 20.8704 |
| Latvia | 2025 | 8.1669 |
| Lithuania | 2025 | 14.6097 |
| Luxembourg | 2025 | 14.2910 |
| Netherlands | 2025 | 23.7163 |
| Norway | 2025 | 16.1432 |
| Poland | 2025 | 5.2906 |
| Portugal | 2025 | 7.2088 |
| Slovak Republic | 2025 | 8.6340 |
| Slovenia | 2025 | 10.9384 |
| Spain | 2025 | 10.6999 |
| Sweden | 2025 | 20.8595 |
| Türkiye | 2025 | 2.7536 |
Mostly 2025, with older observations and differing national definitions. Definitions, coverage and calculation.
OECD chapter / Figure 3.4 ↗ · Original workbook ↗ · Workbook snapshot · 29 observations · CSV · Data & provenance · JSON
United States / Census BTOS
Two business measures, separate questions.
| Measure | Share of businesses | Standard error (pp) |
|---|---|---|
| AI use in any business function | 24.2% | 0.61 |
| Business reports employees using generative AI for work | 26.8% | 0.56 |
Both figures are percentages of covered nonfarm employer businesses, not employees. Reference period 5–18 October; collection 19 October–1 November; released 5 November 2026. The questions overlap. Wording changed to SI in this collection, so no trend is inferred or direct UK/EU ranking made. Sampling and comparability.
5 November release ↗ · Survey notes ↗ · Methodology ↗ · National workbook snapshot · Two observations · CSV · Data & provenance · JSON
Separate workflow evidence
Science · research sessions by task
Eight categories, two interfaces, 16 observations. The existing 335-observation ledger is unchanged.
Study / Figure 3 ↗ · Technical appendix ↗ · 16 workflow observations · CSV · Data & provenance · JSON
Australian work evidence
Recruitment and productivity remain separate measures.
ABS adds four published shares of businesses reporting perceived AI effects on vacancies. Their unexplained 99.2% total is retained and flagged. RBA adds approximate liaison context on productivity gains. Neither source is pooled with adoption rates.
All 335 core ledger observations and 16 separate science workflow observations remain unchanged.
ABS values and chart → · RBA context → · ABS · CSV · ABS provenance · JSON · RBA provenance · JSON · Australian sources and methods →
Original presentation
Five reports. Every page.
All 94 pages preserve maps, unlabeled series, appendices, methods and references. Physical PDF page numbers are used throughout.

Browse all reports and 94 page images directly
Global · H1 2025
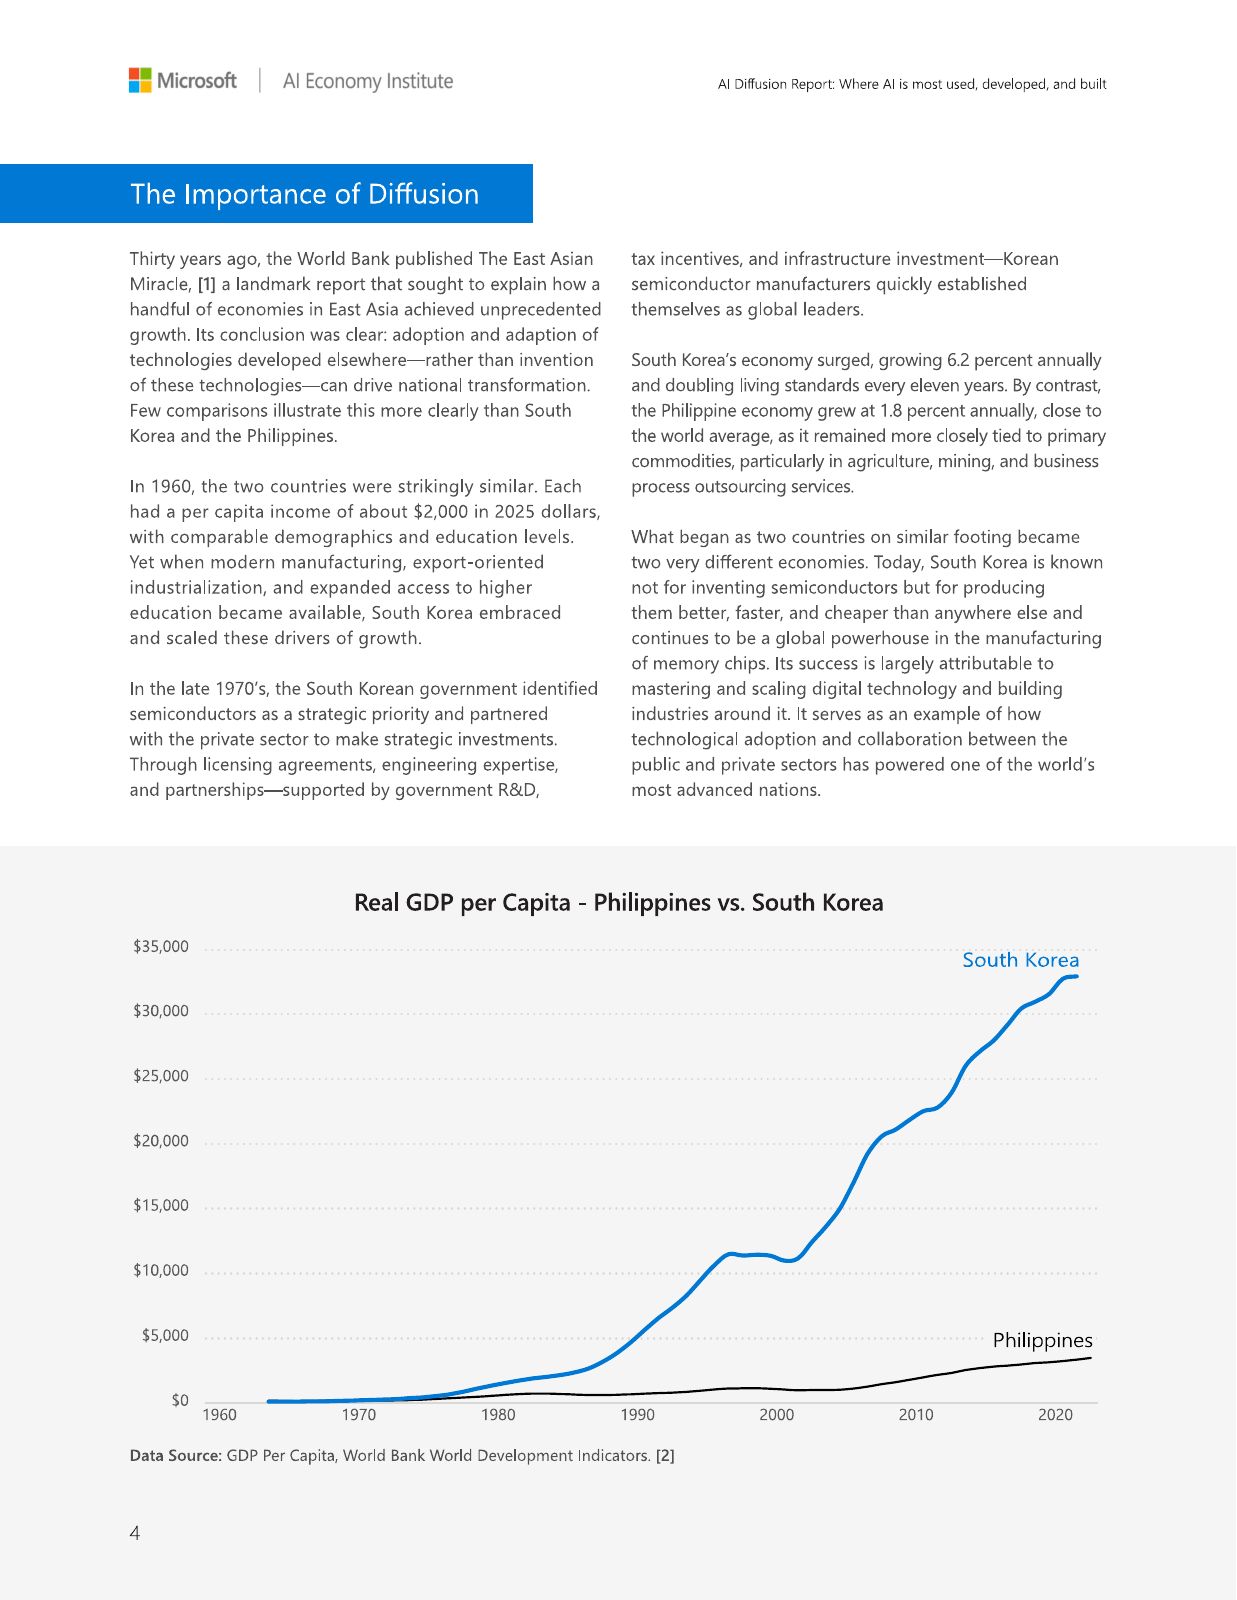
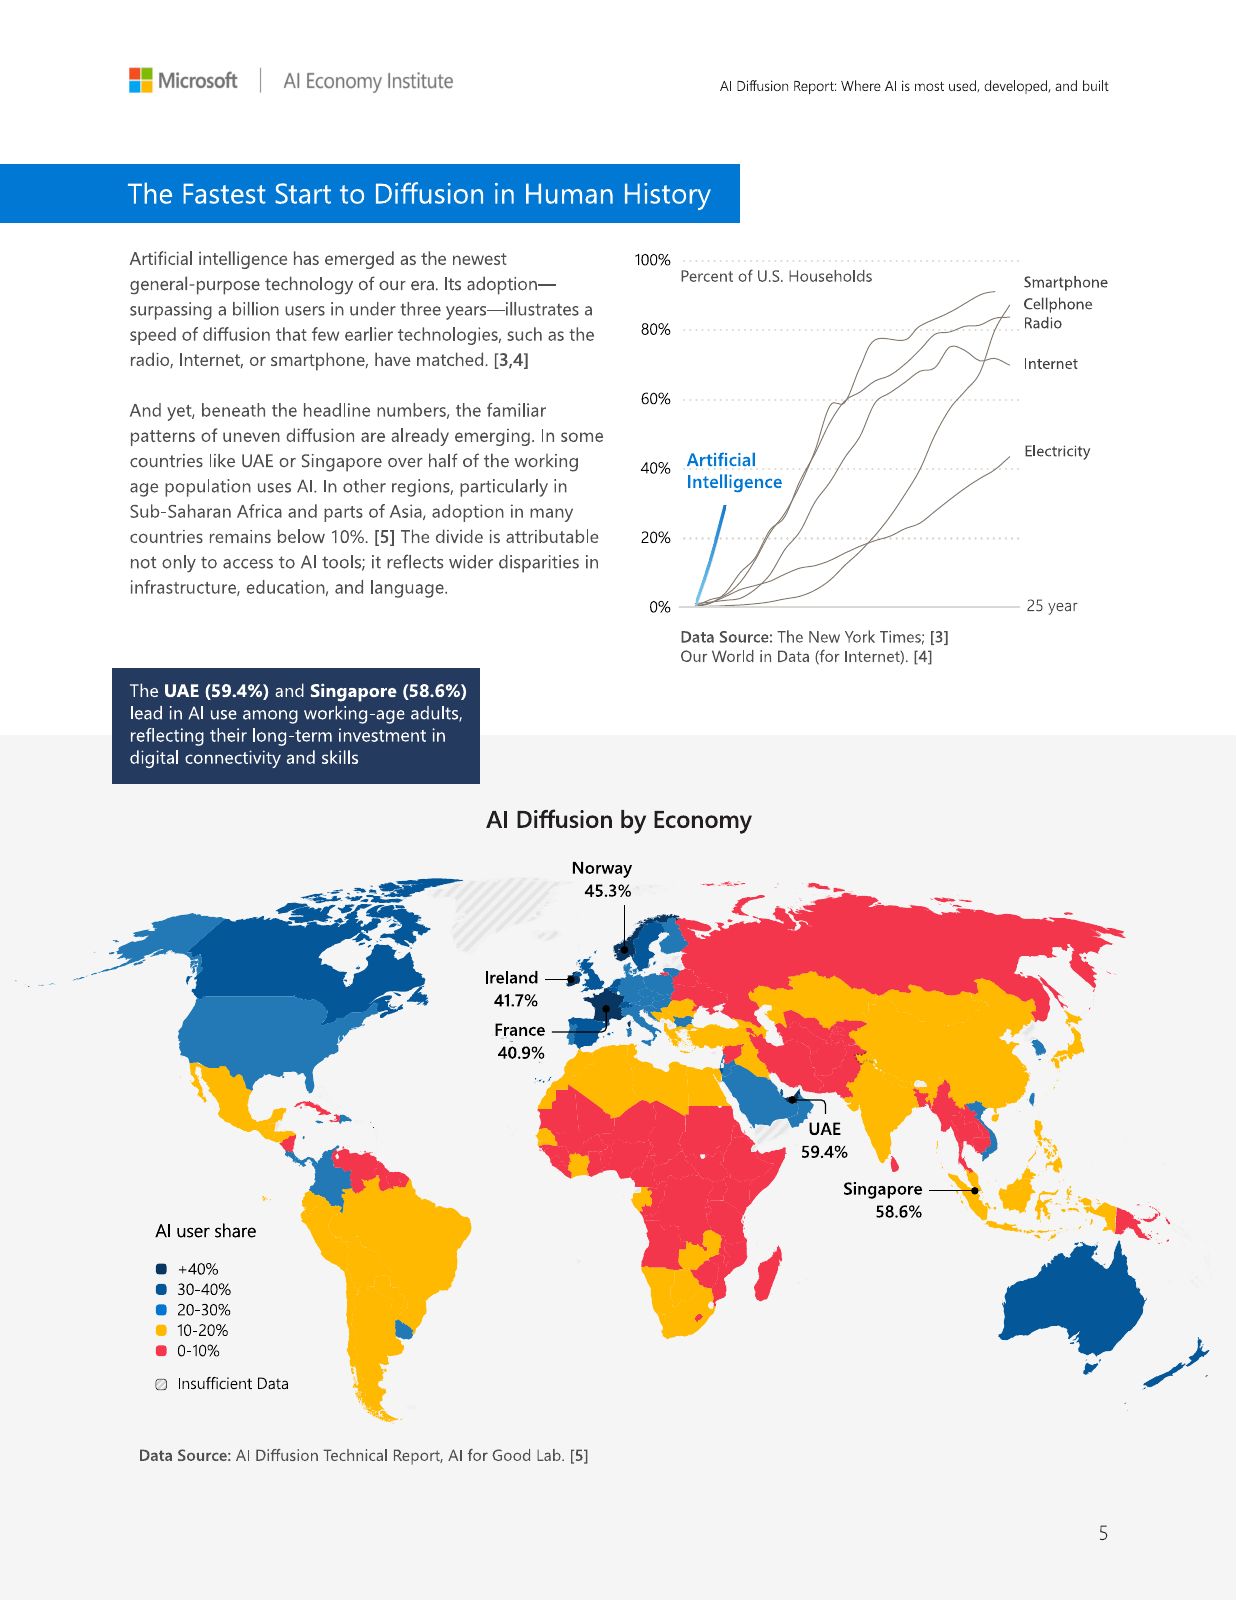
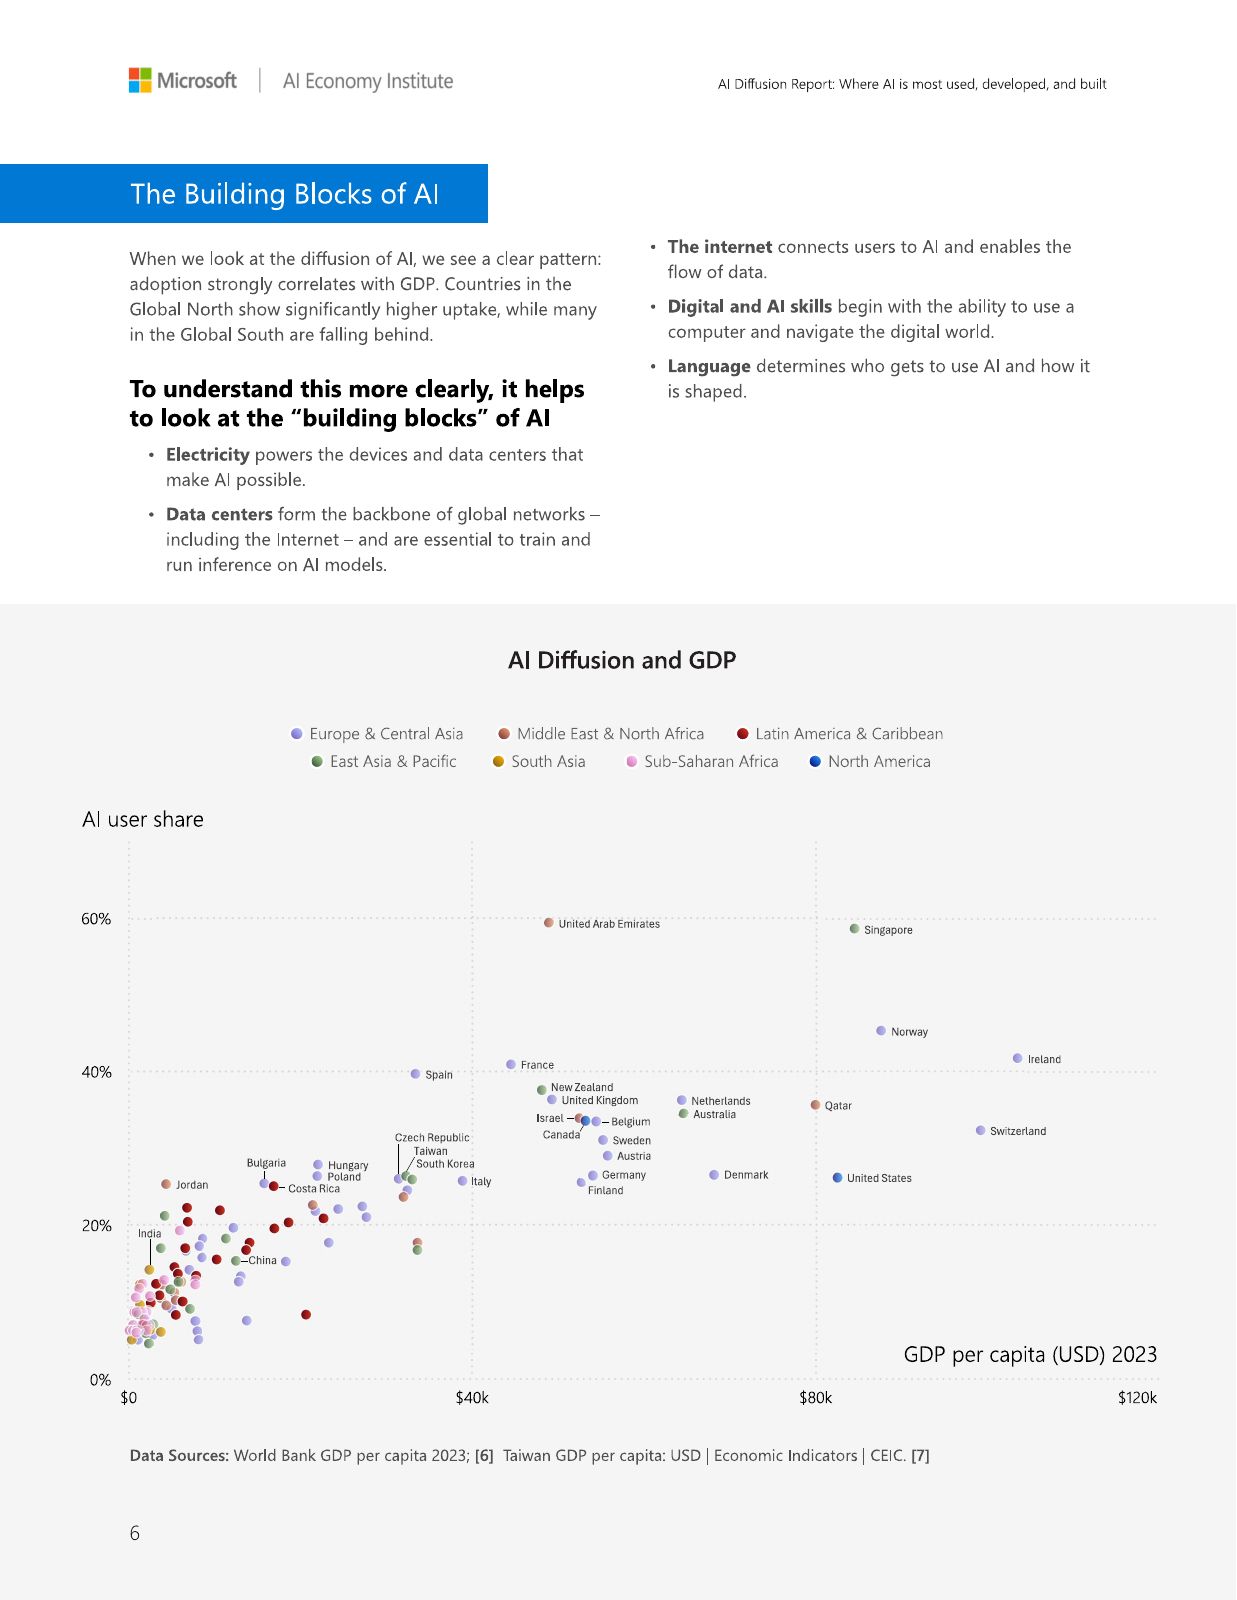
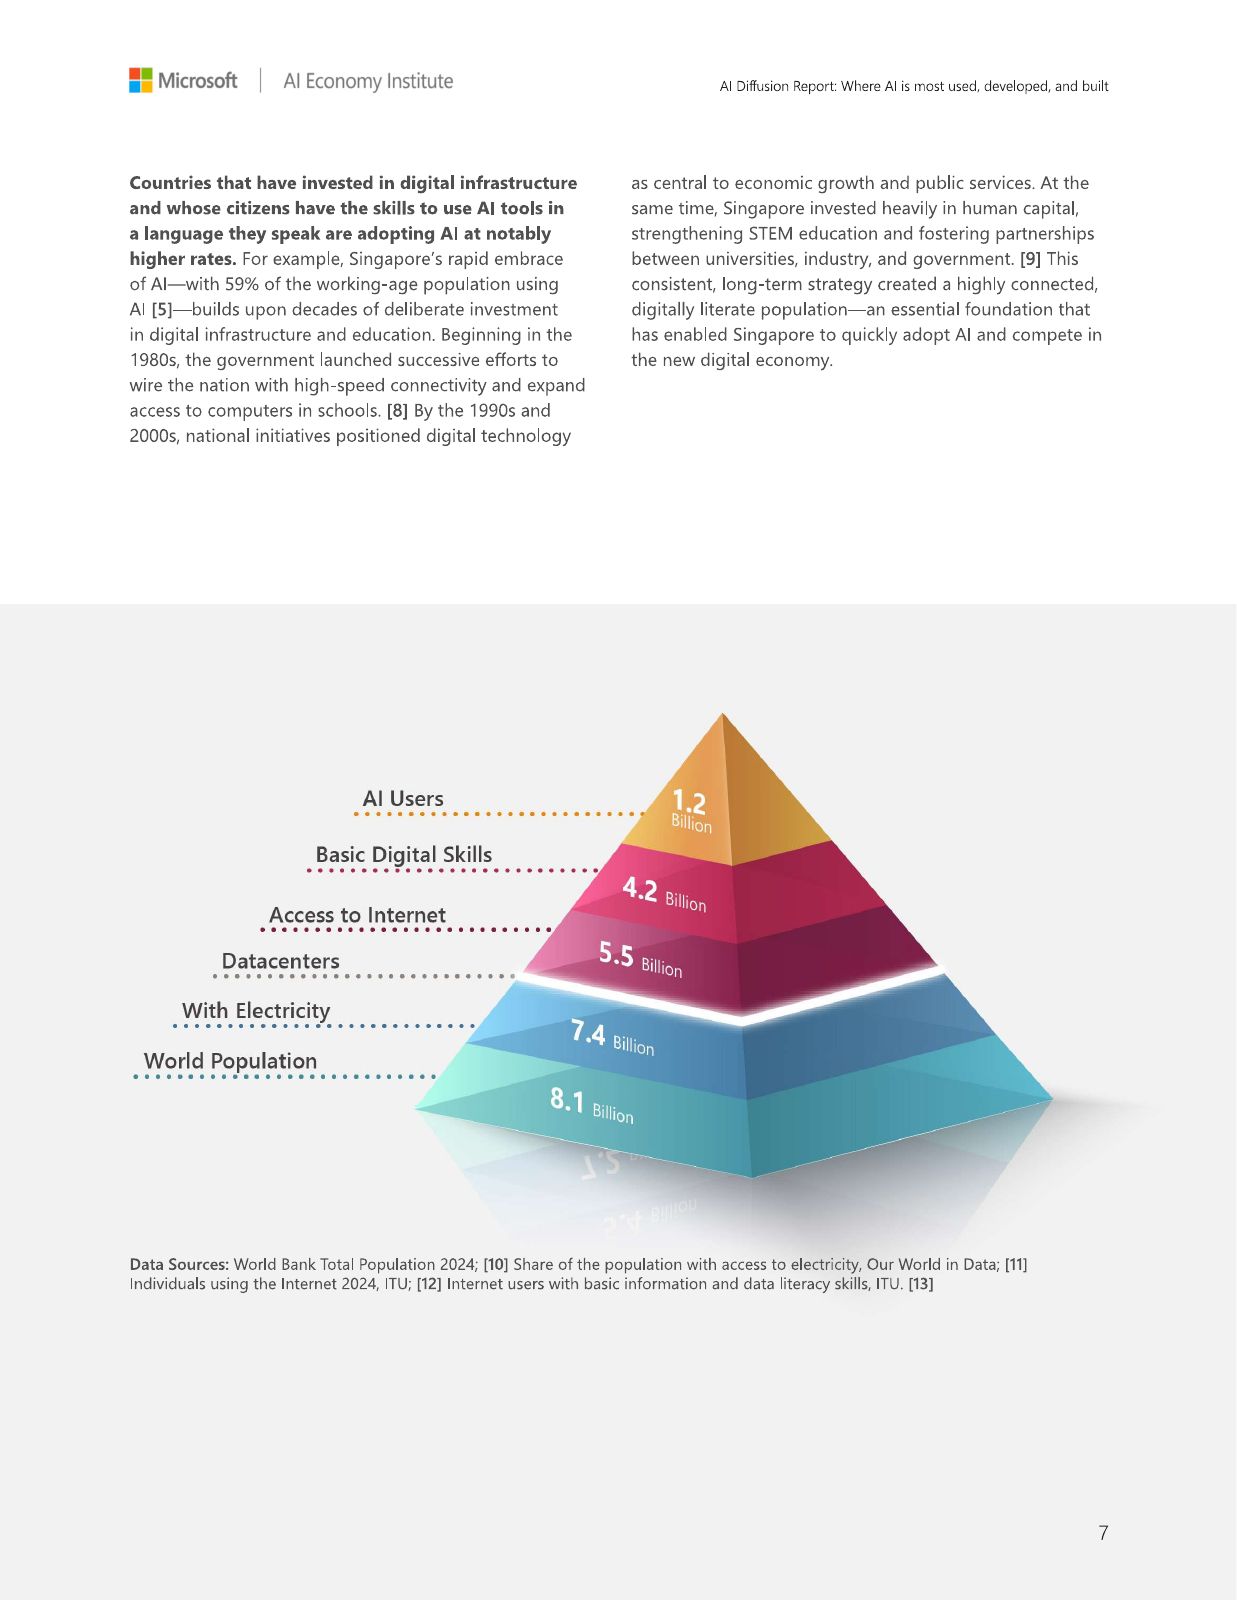
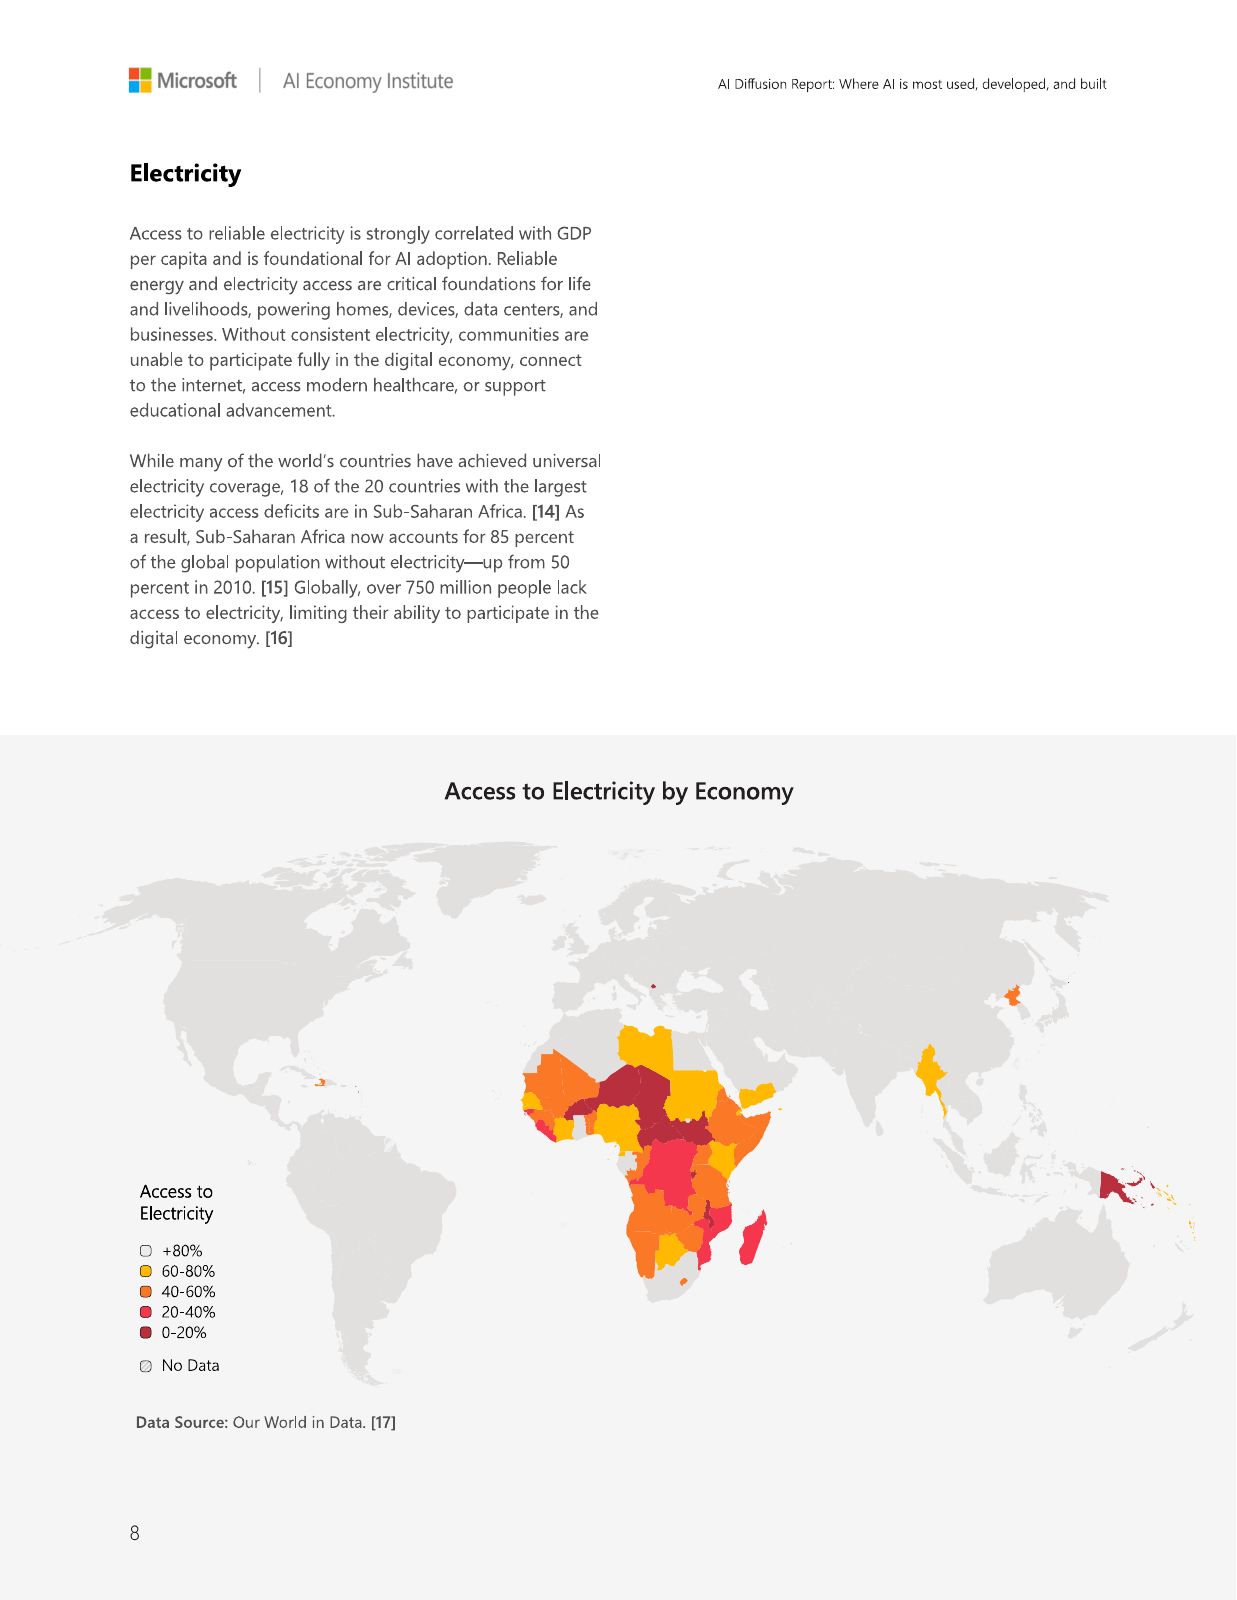
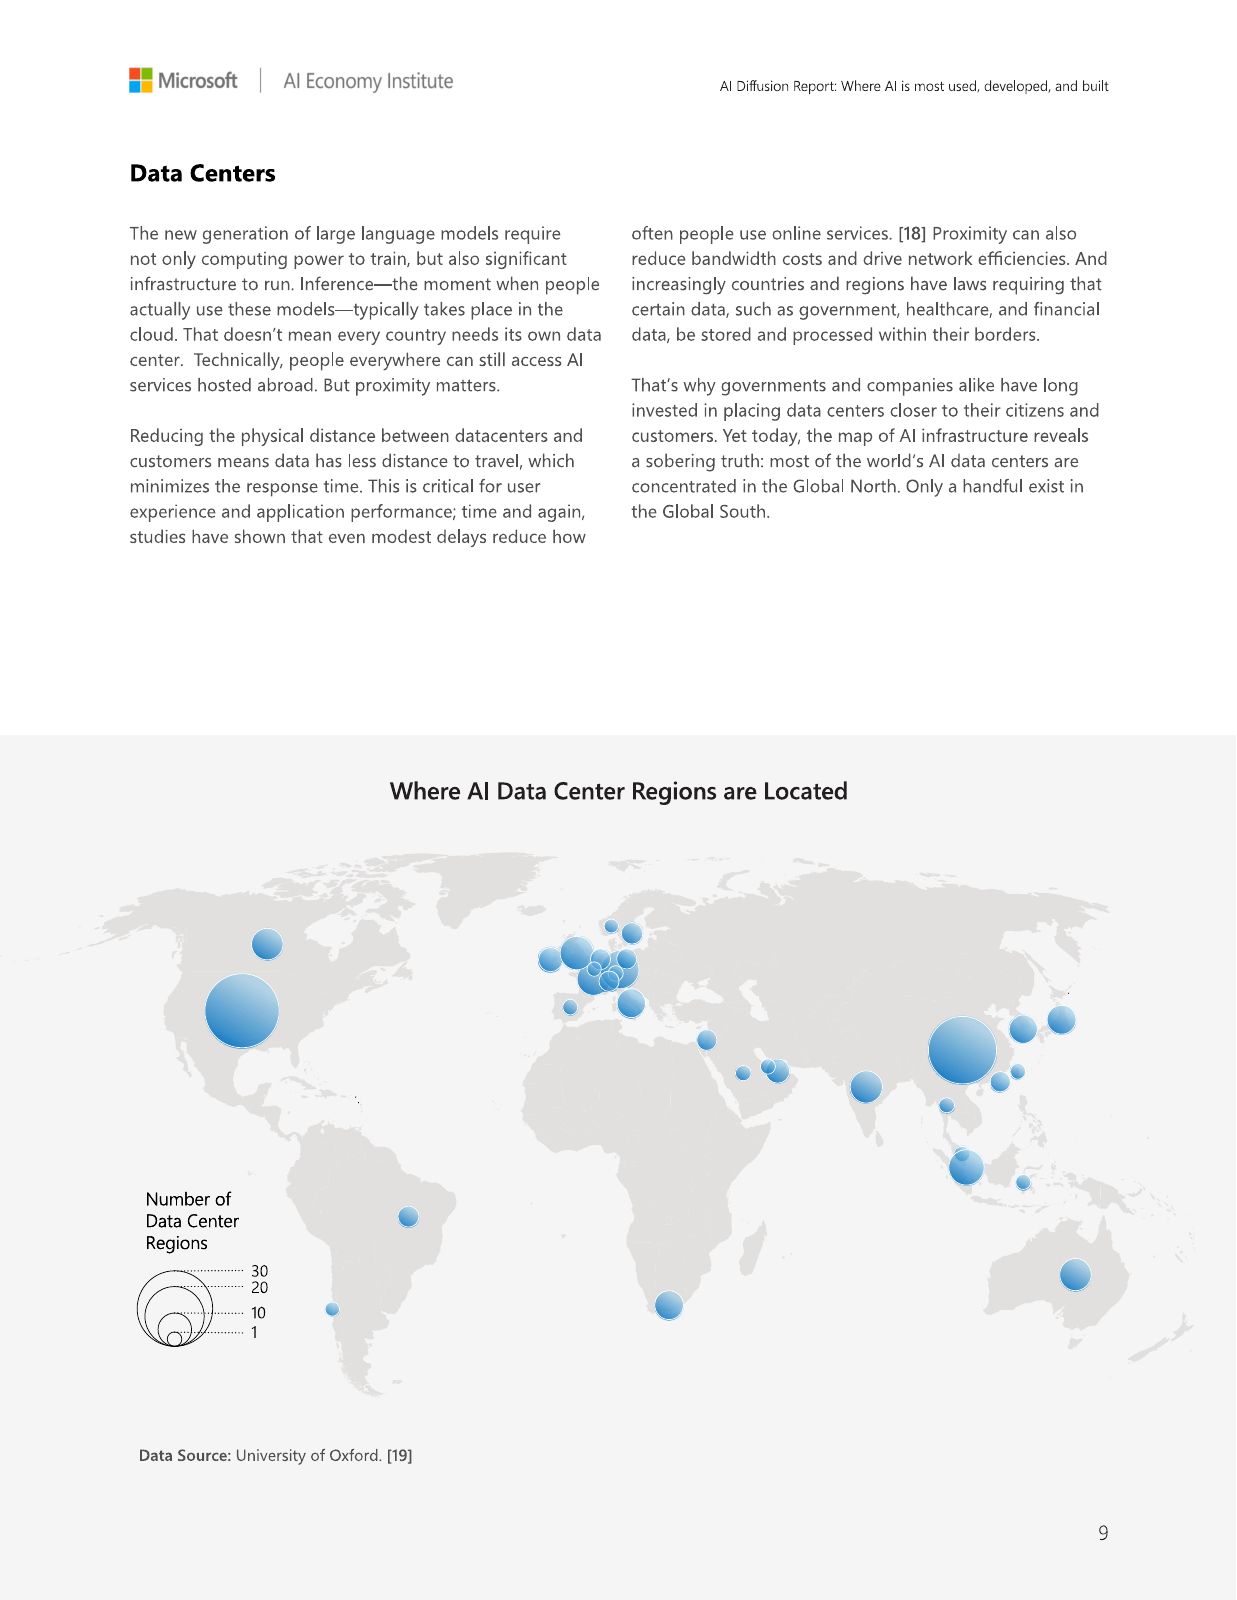
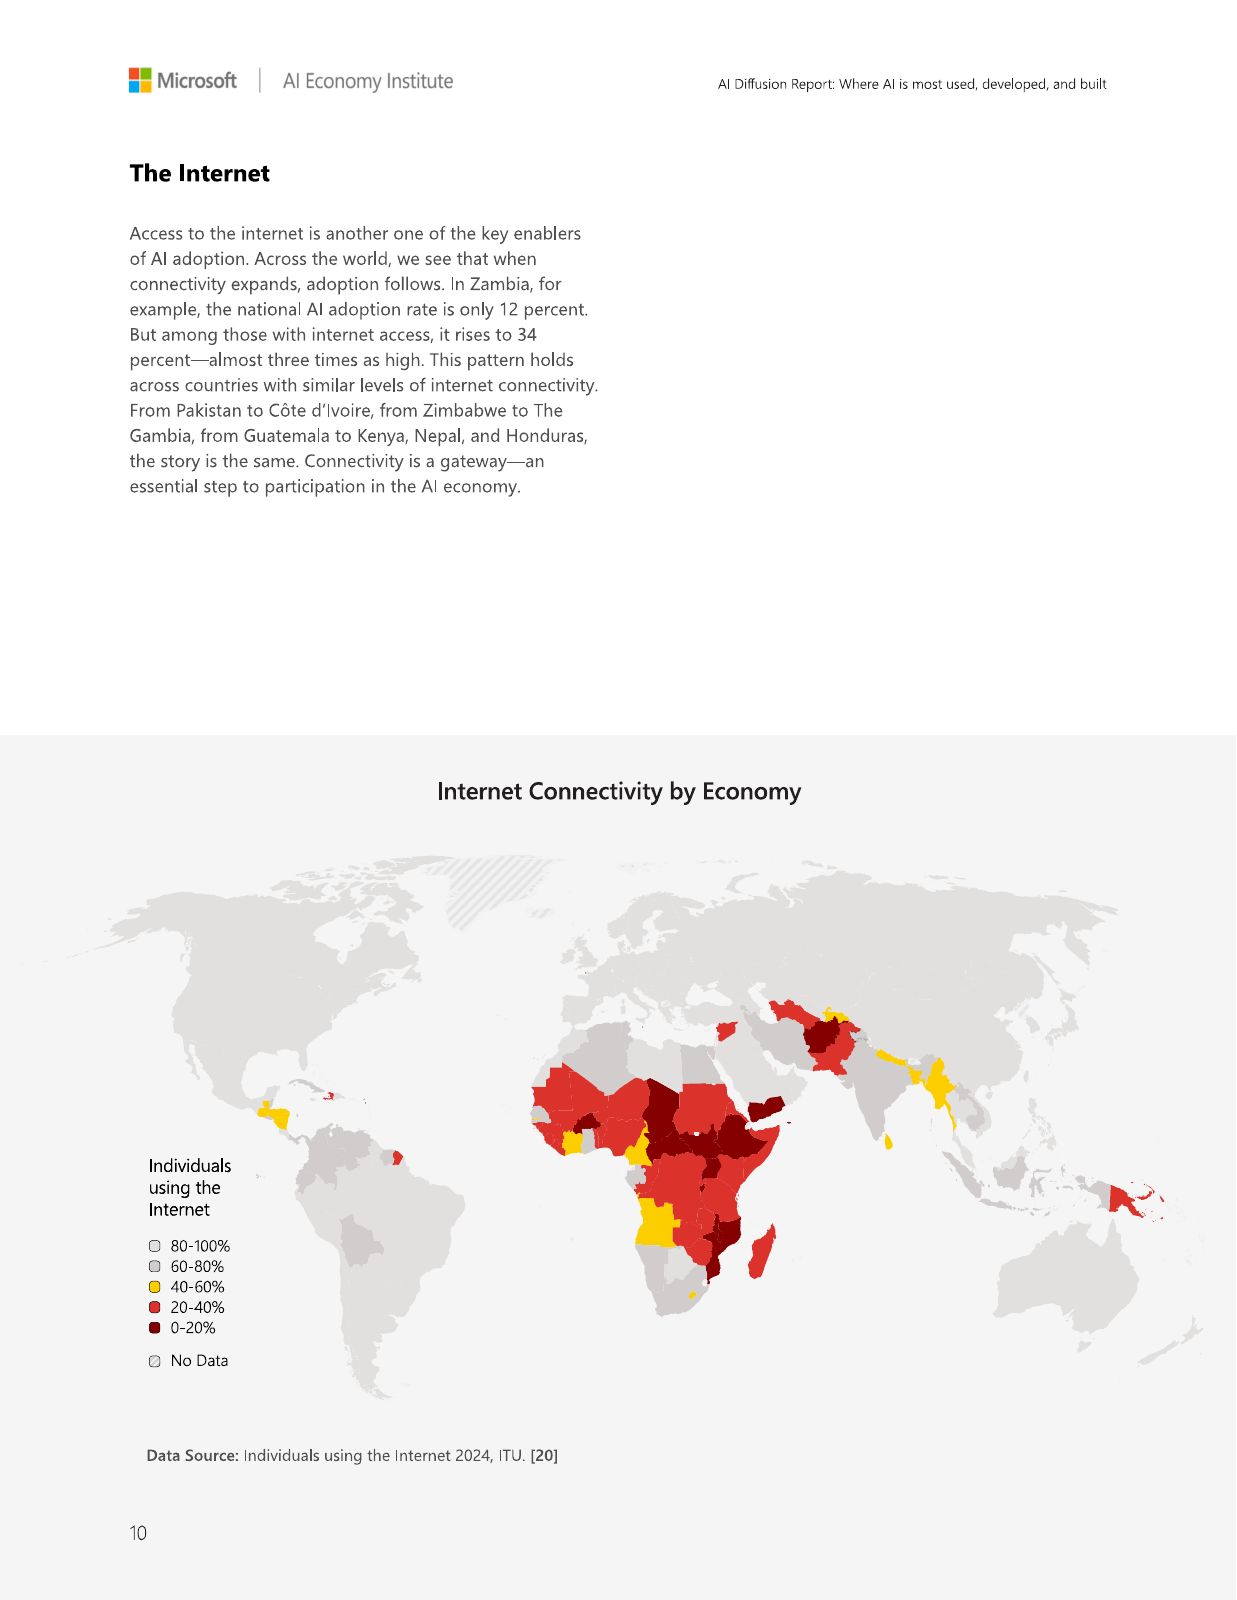
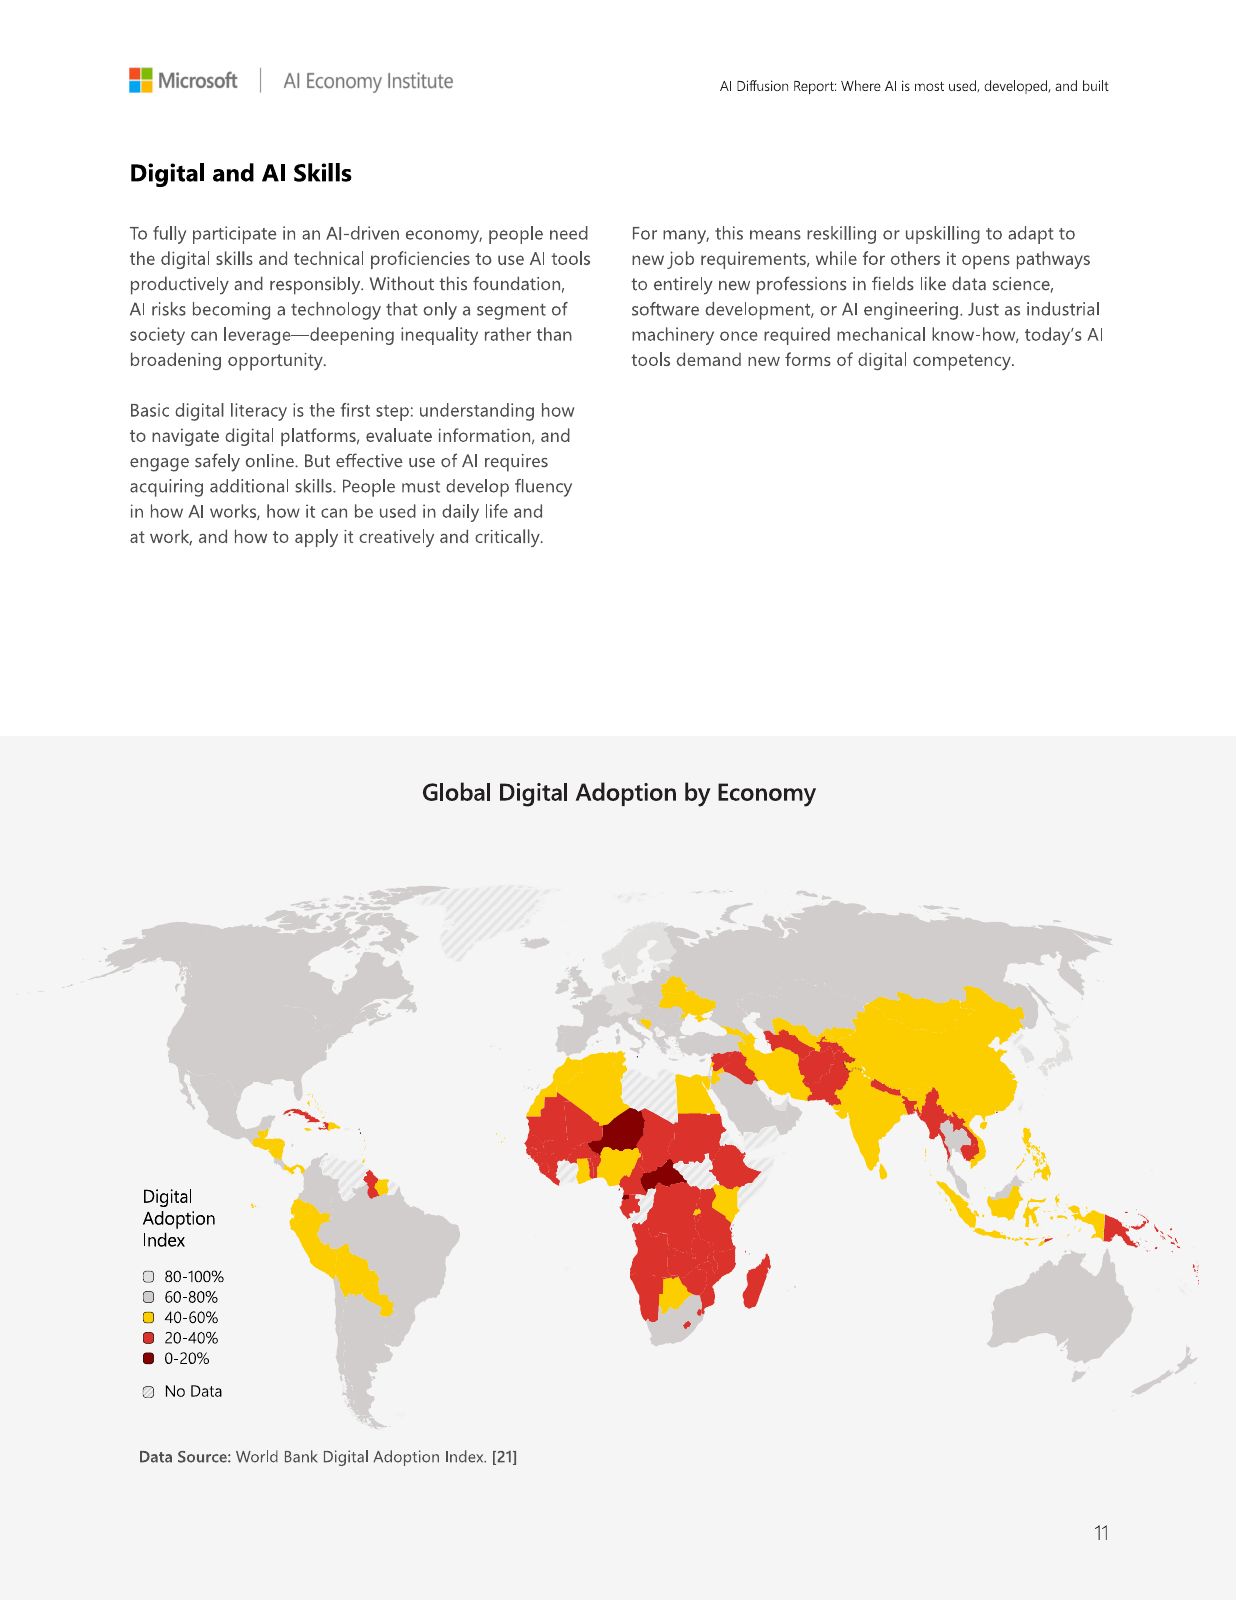
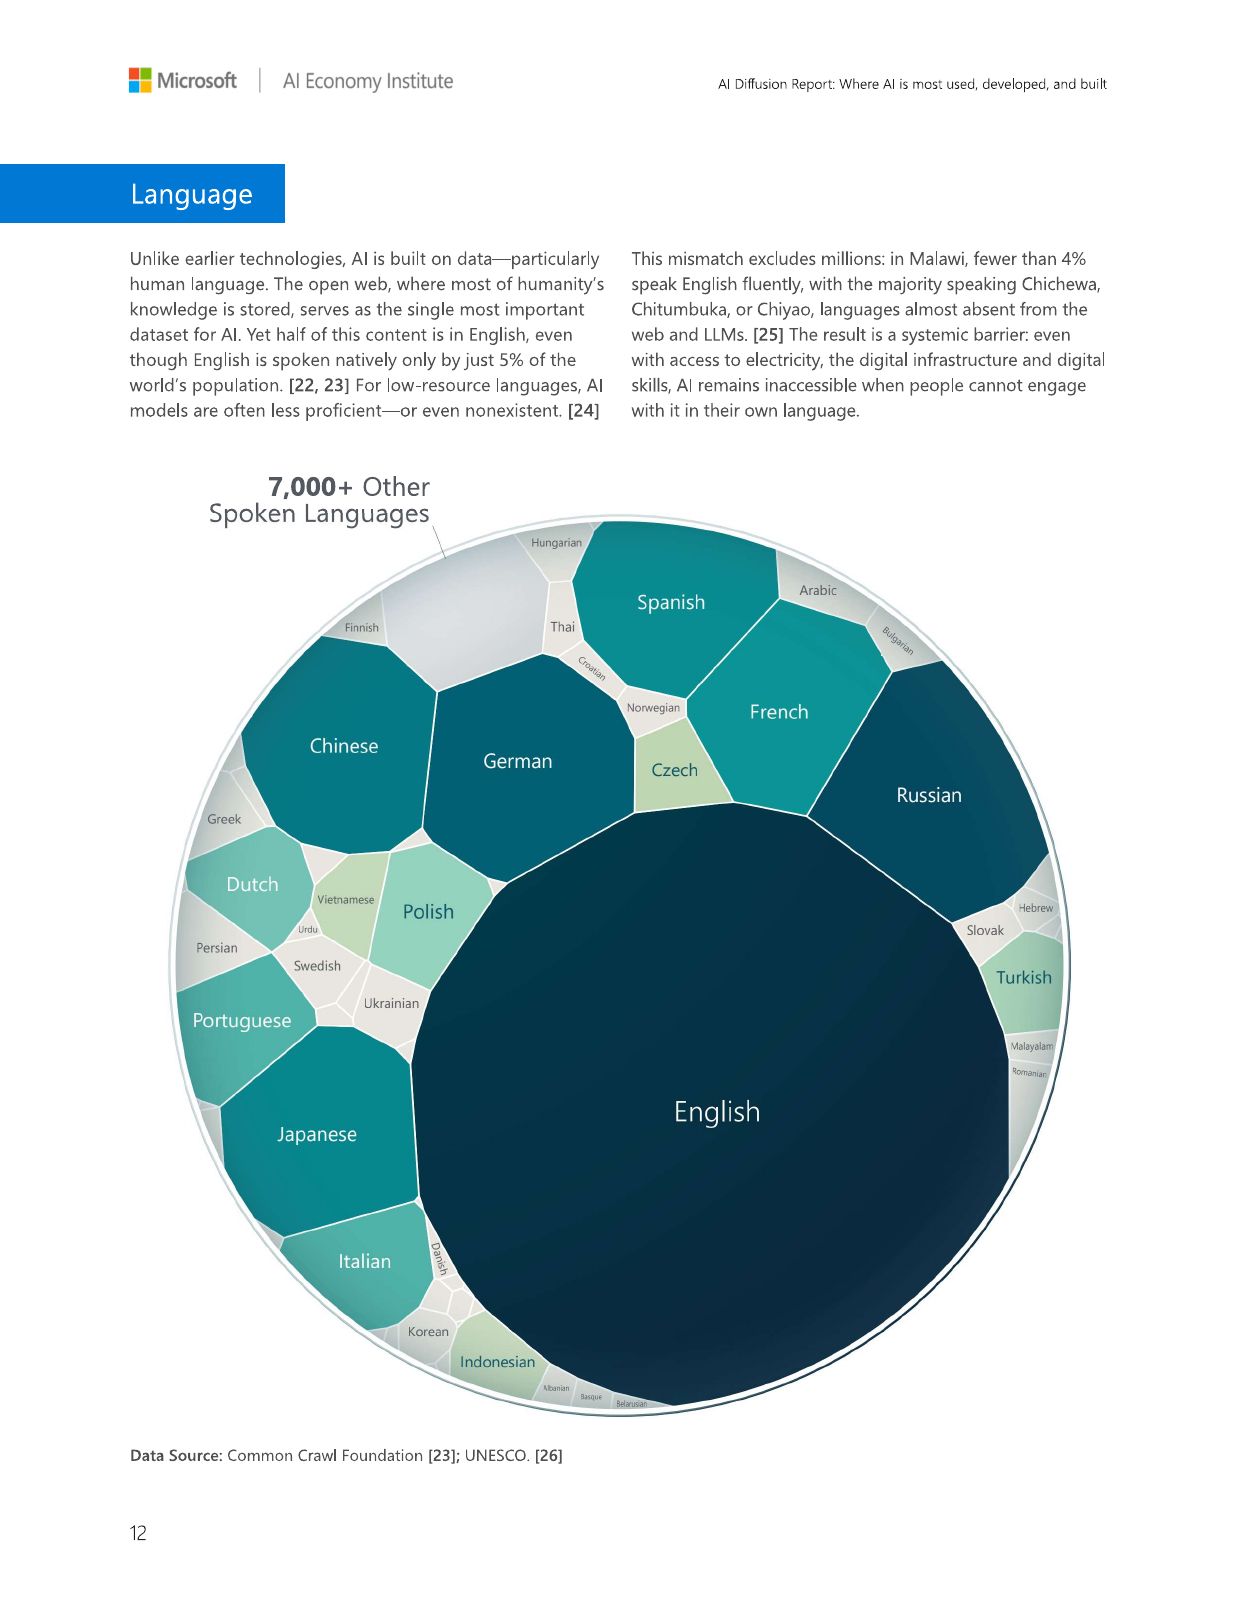
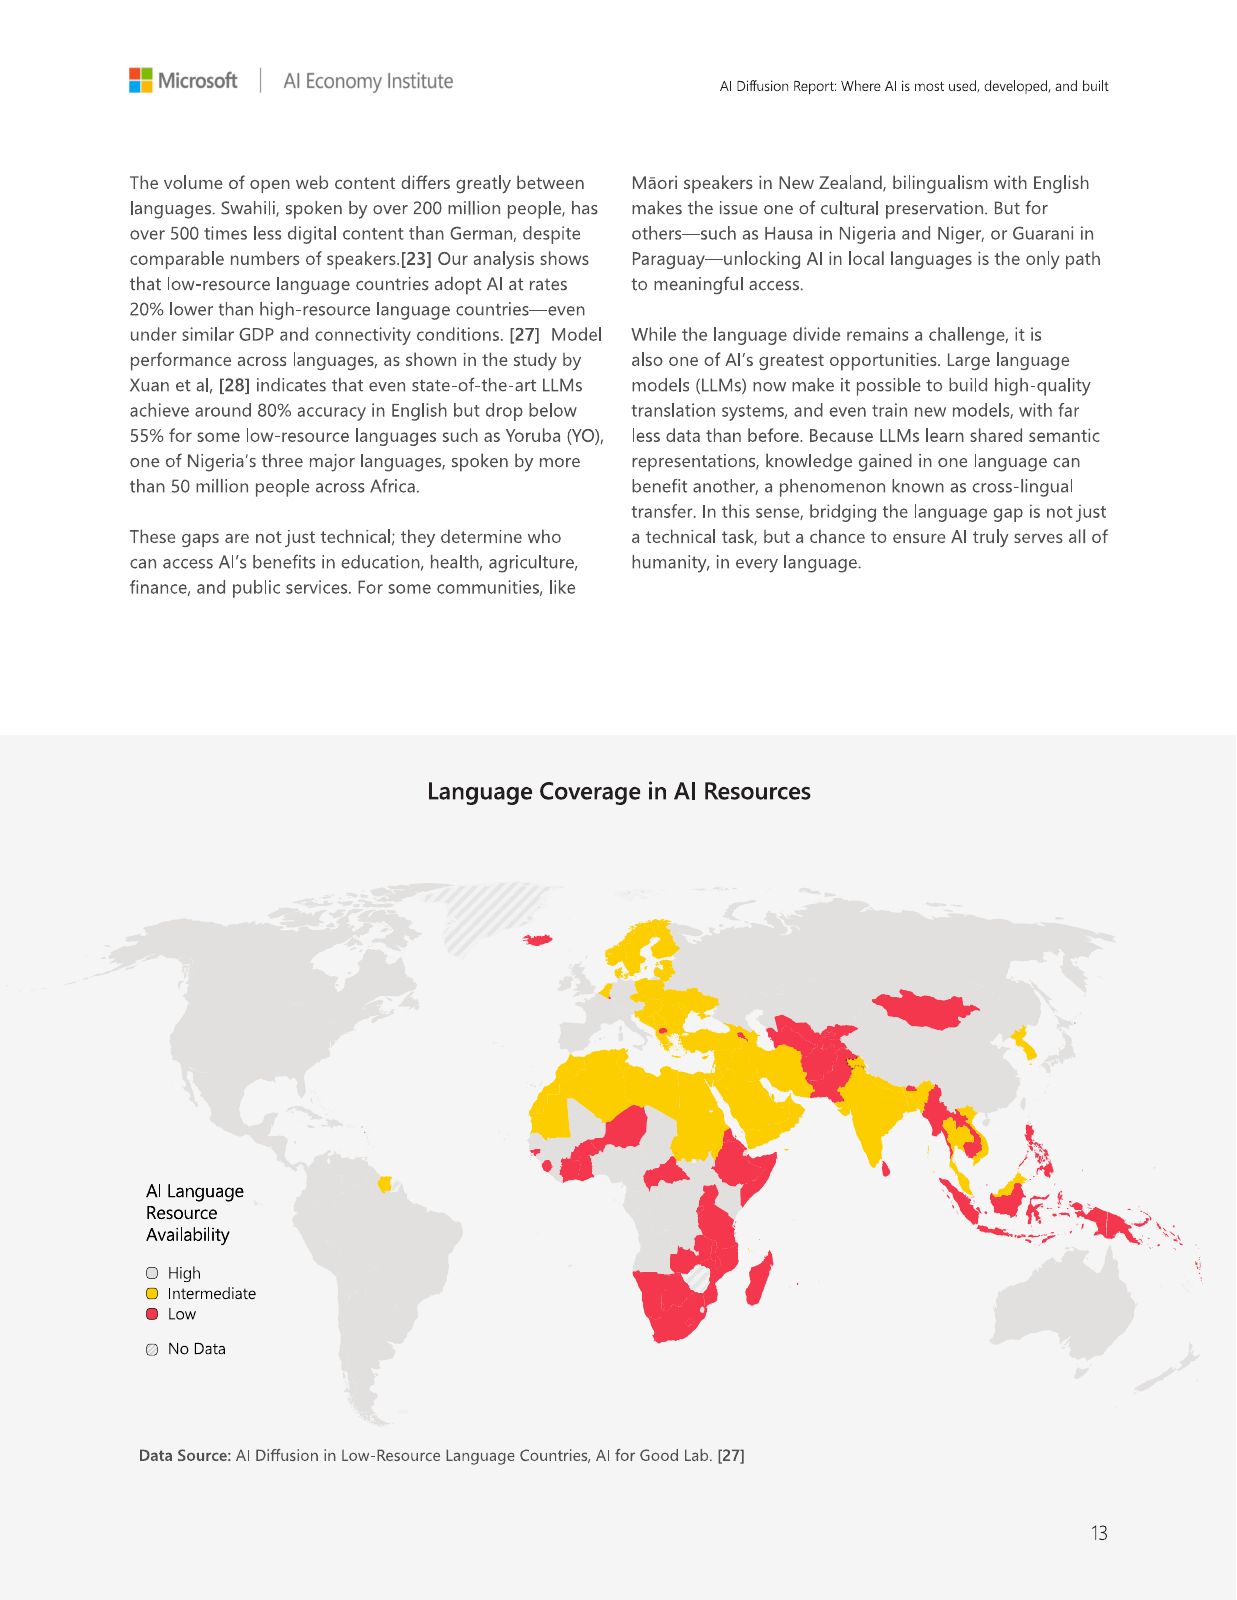
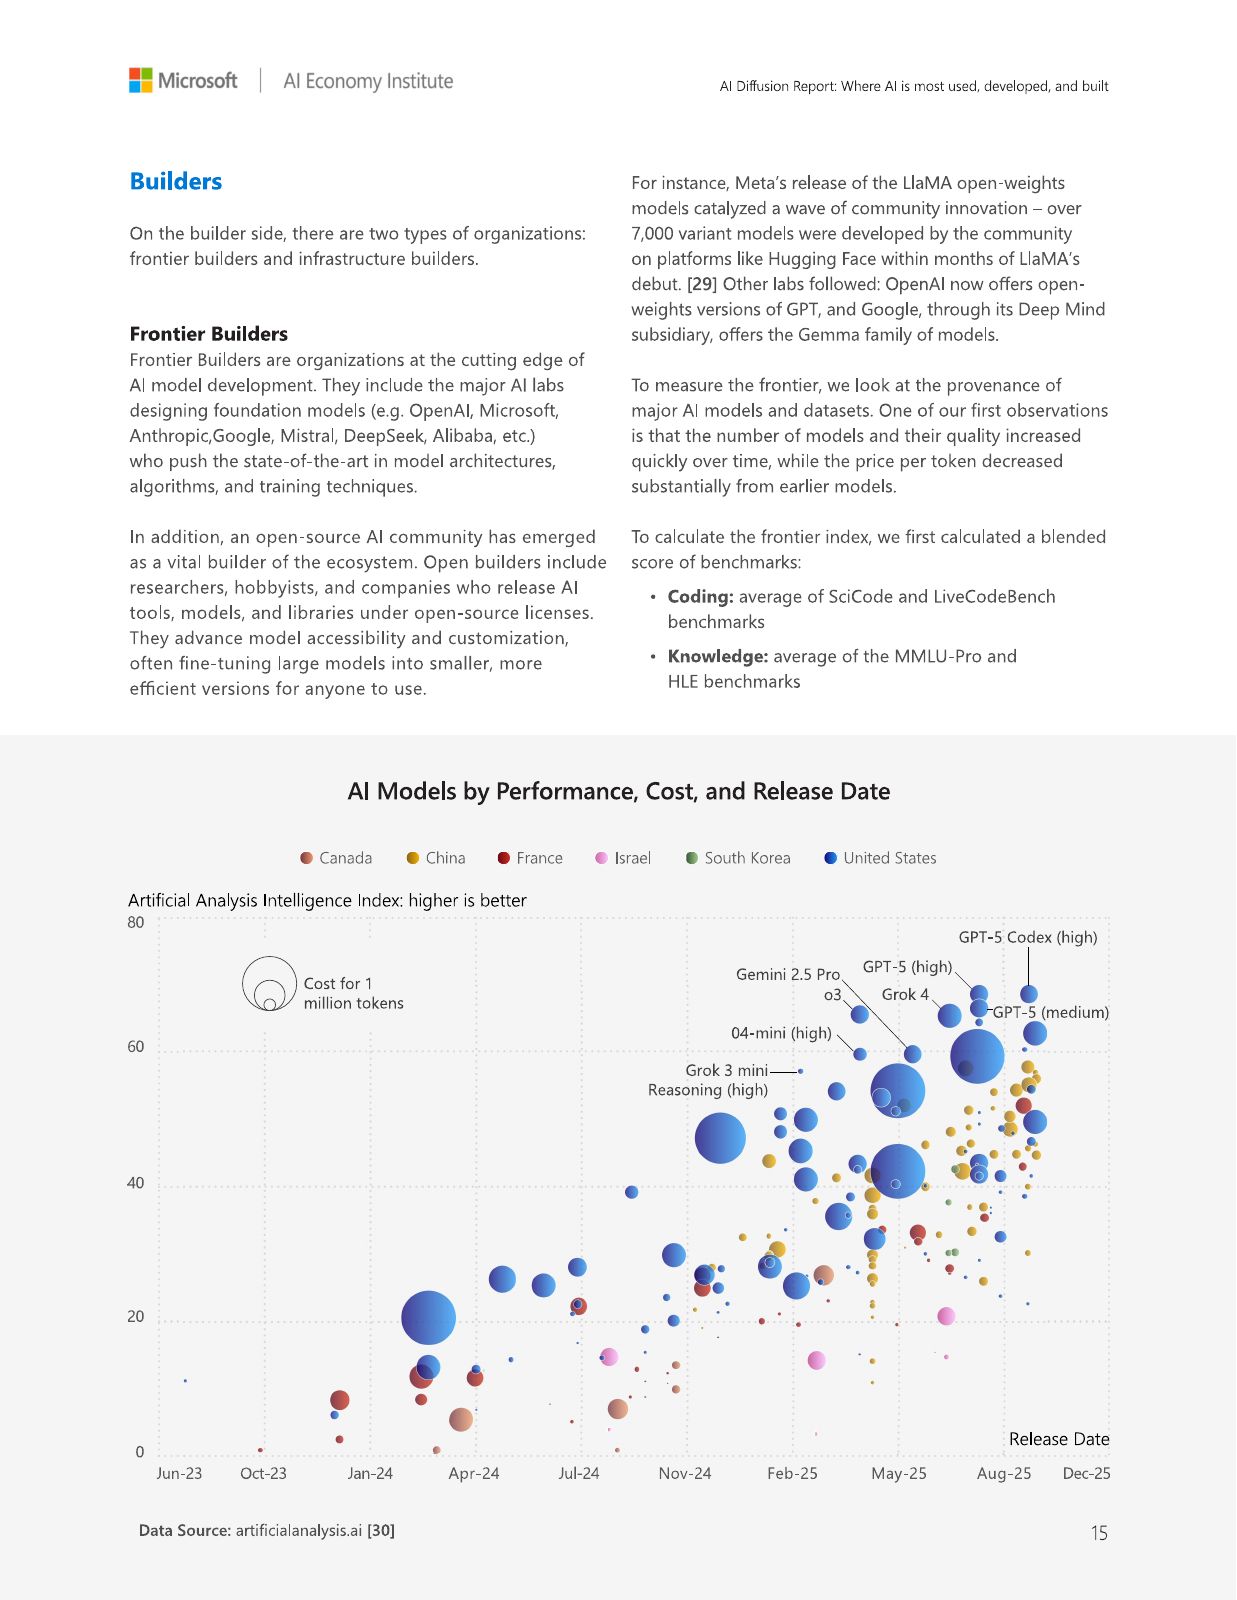
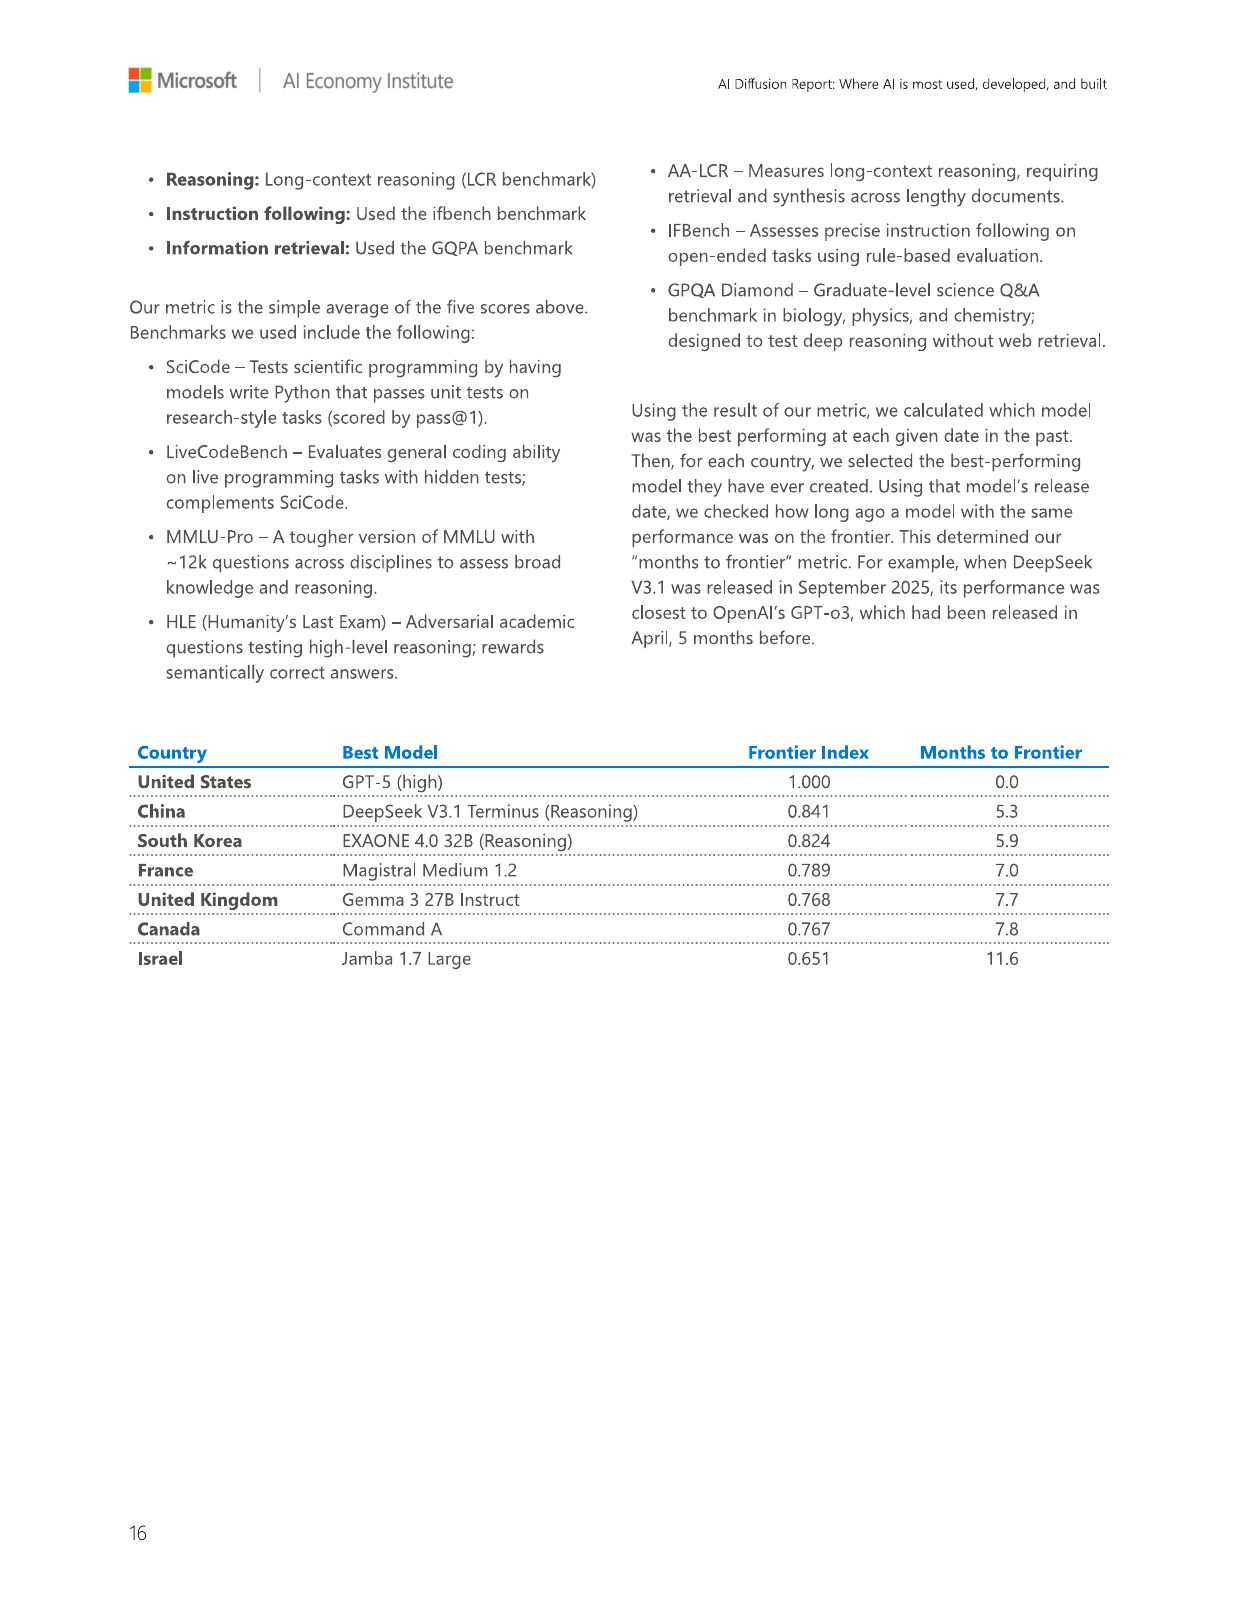
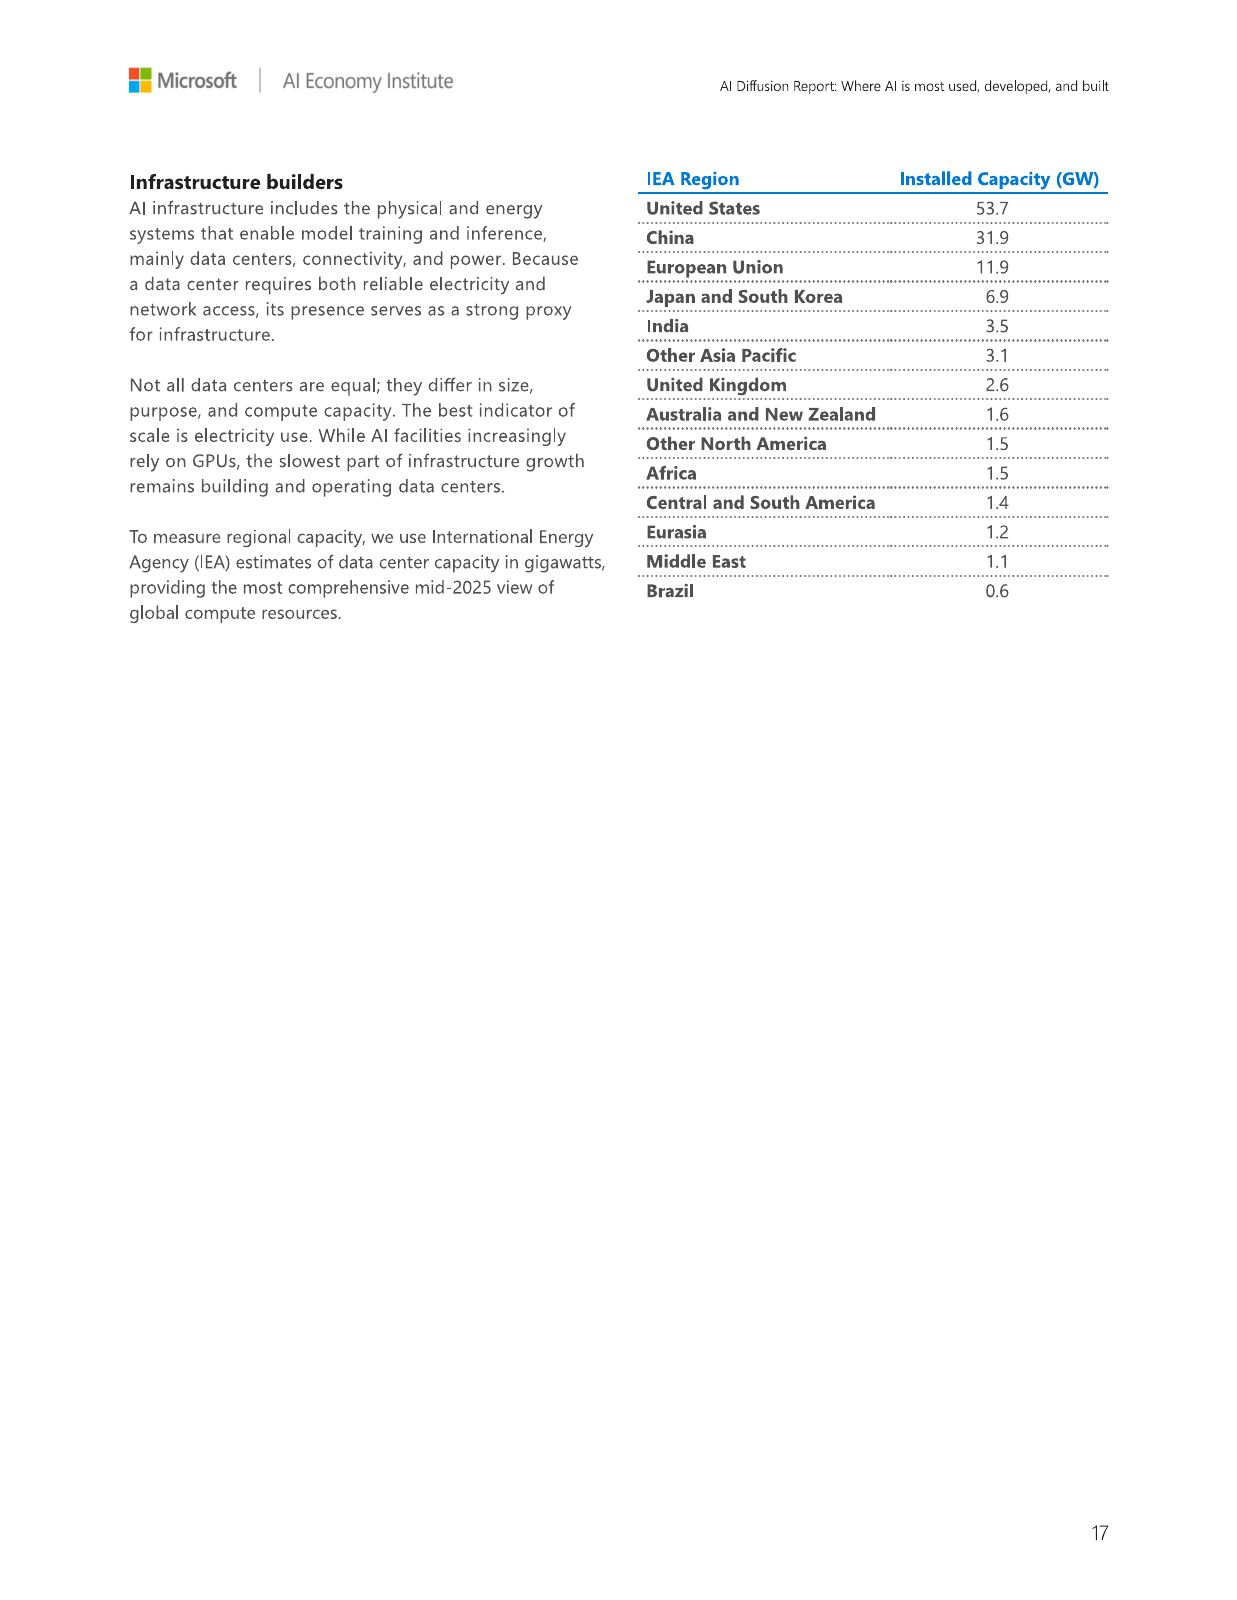
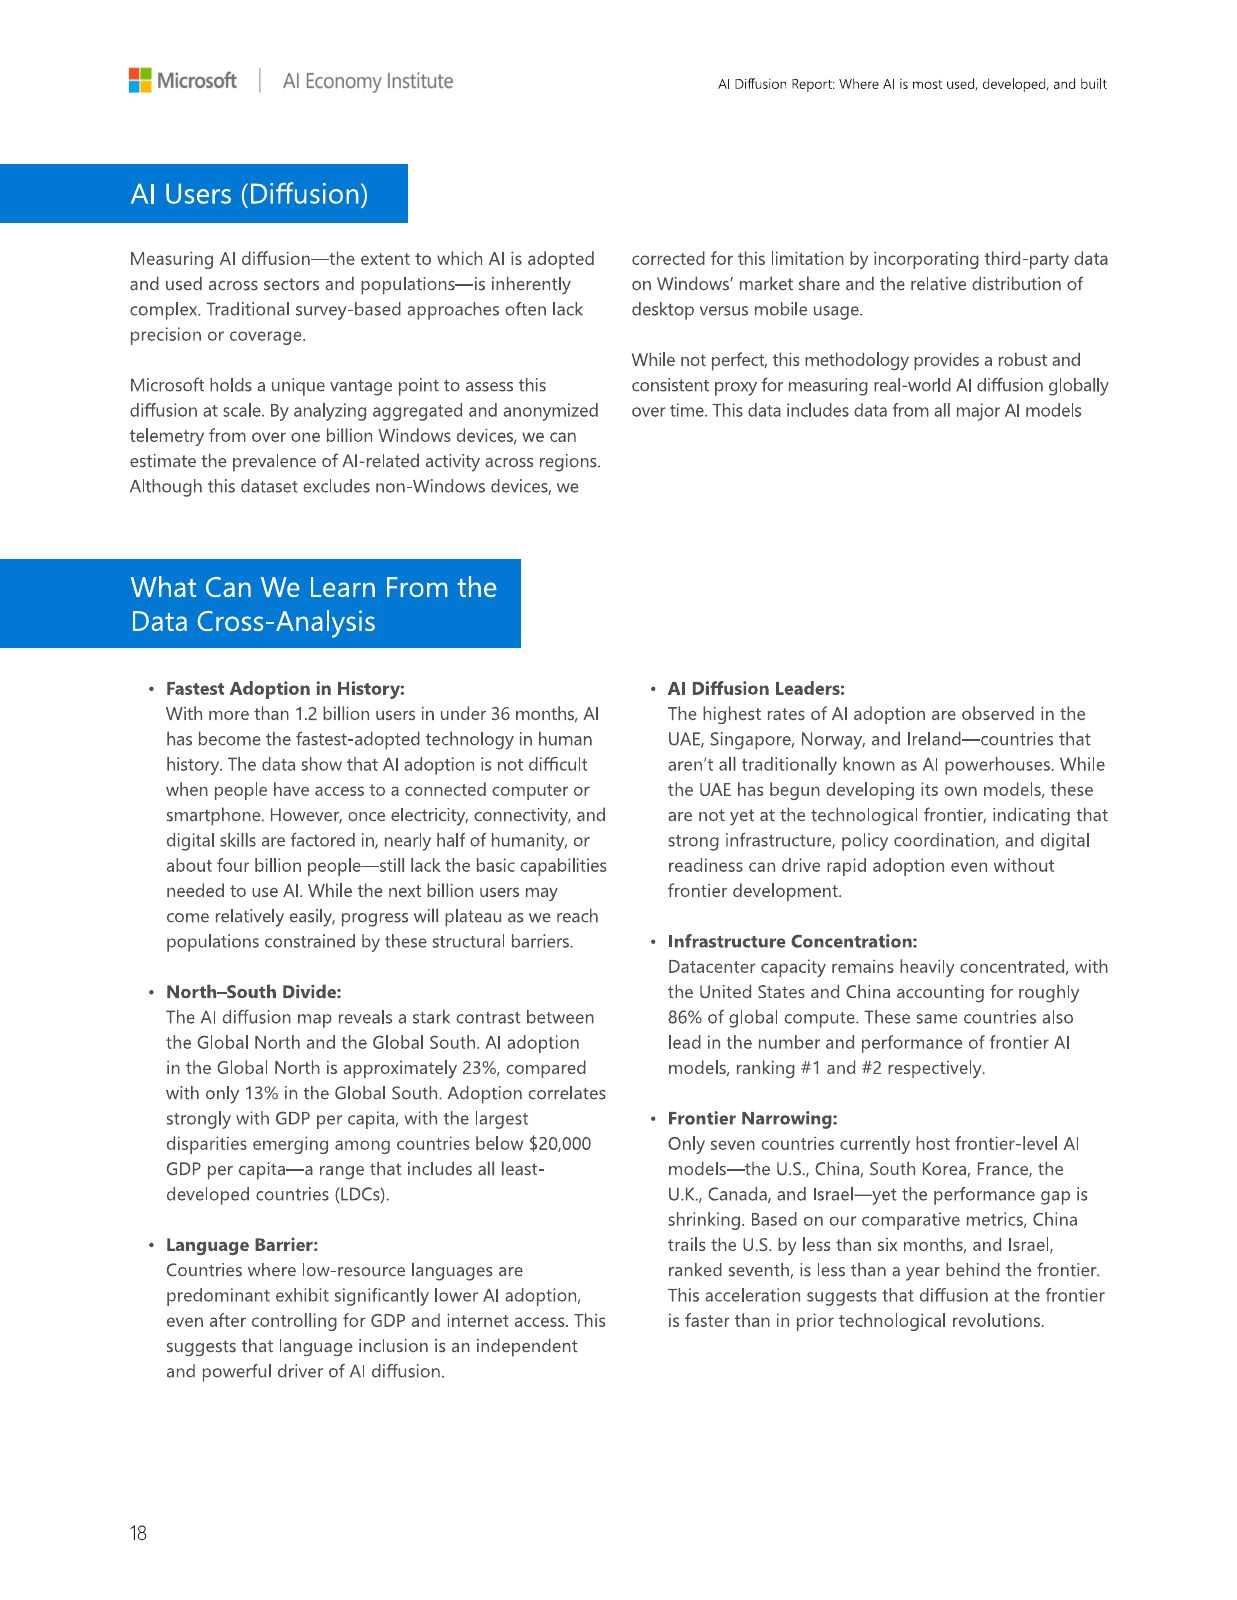
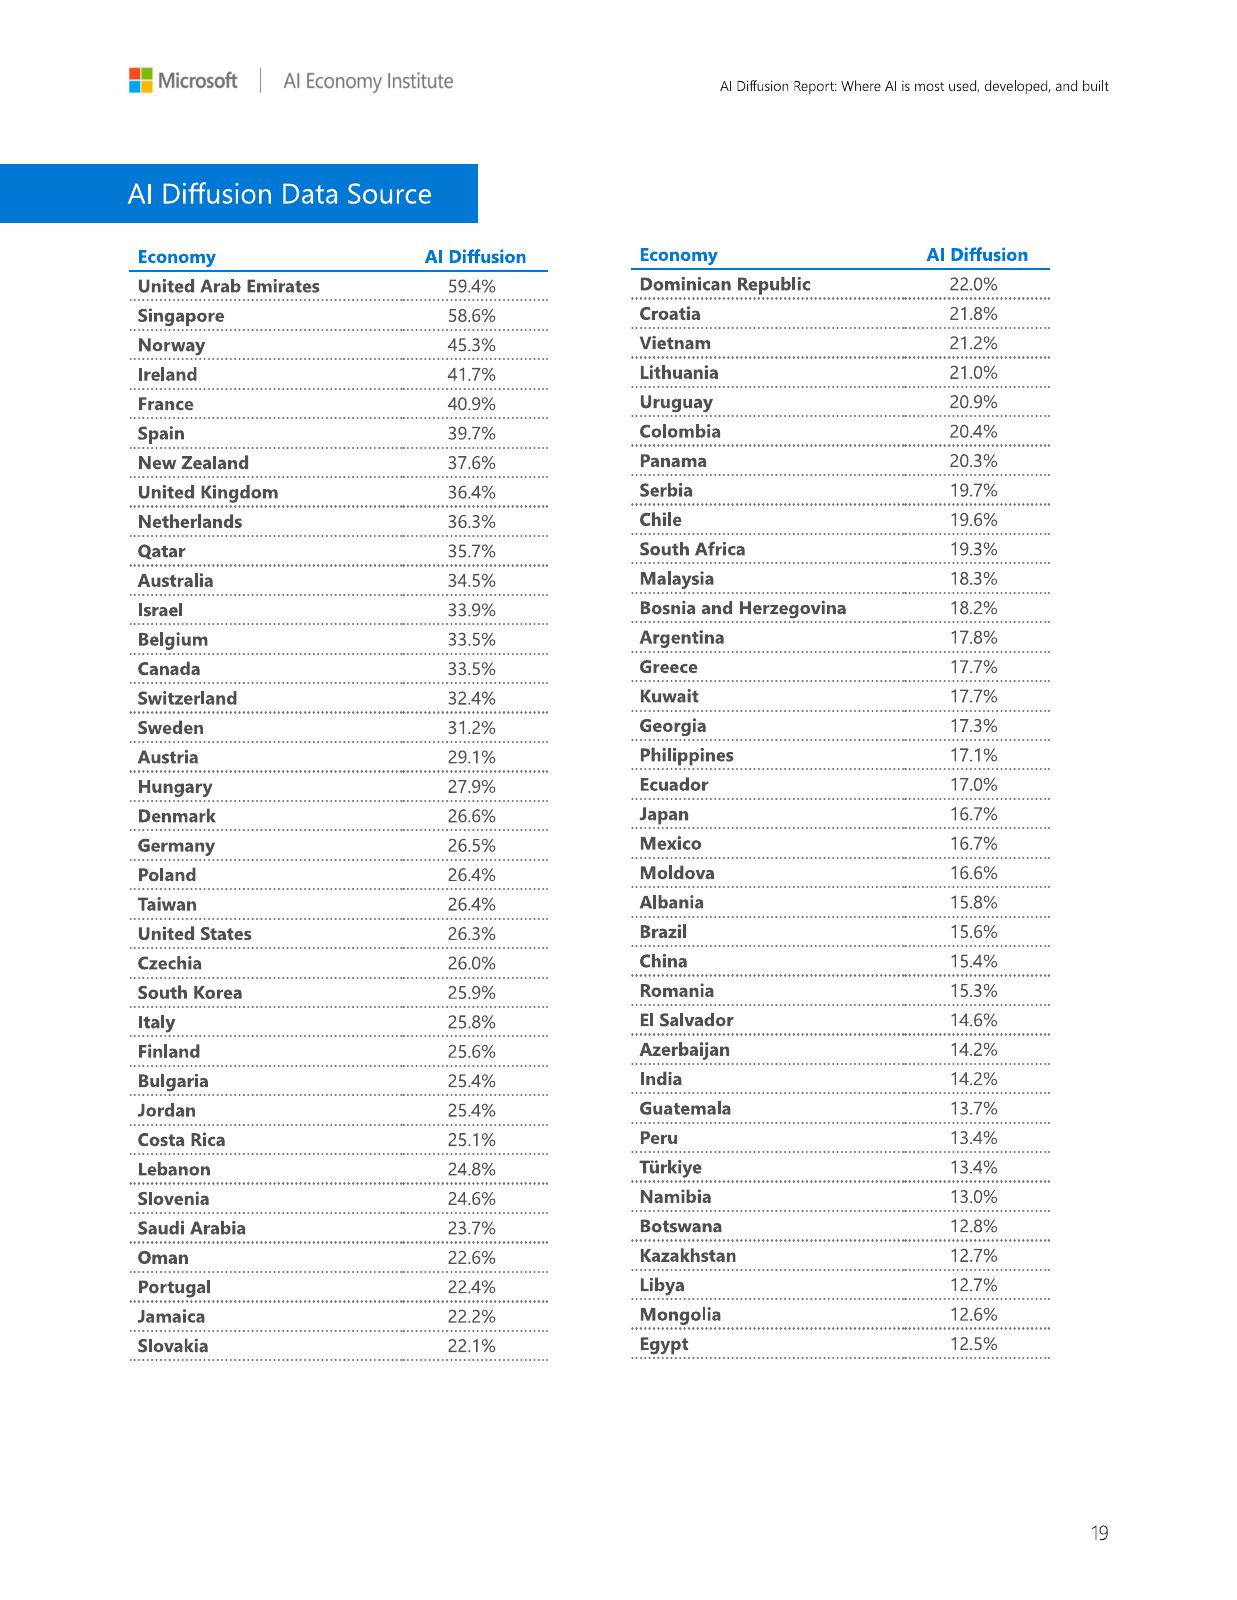
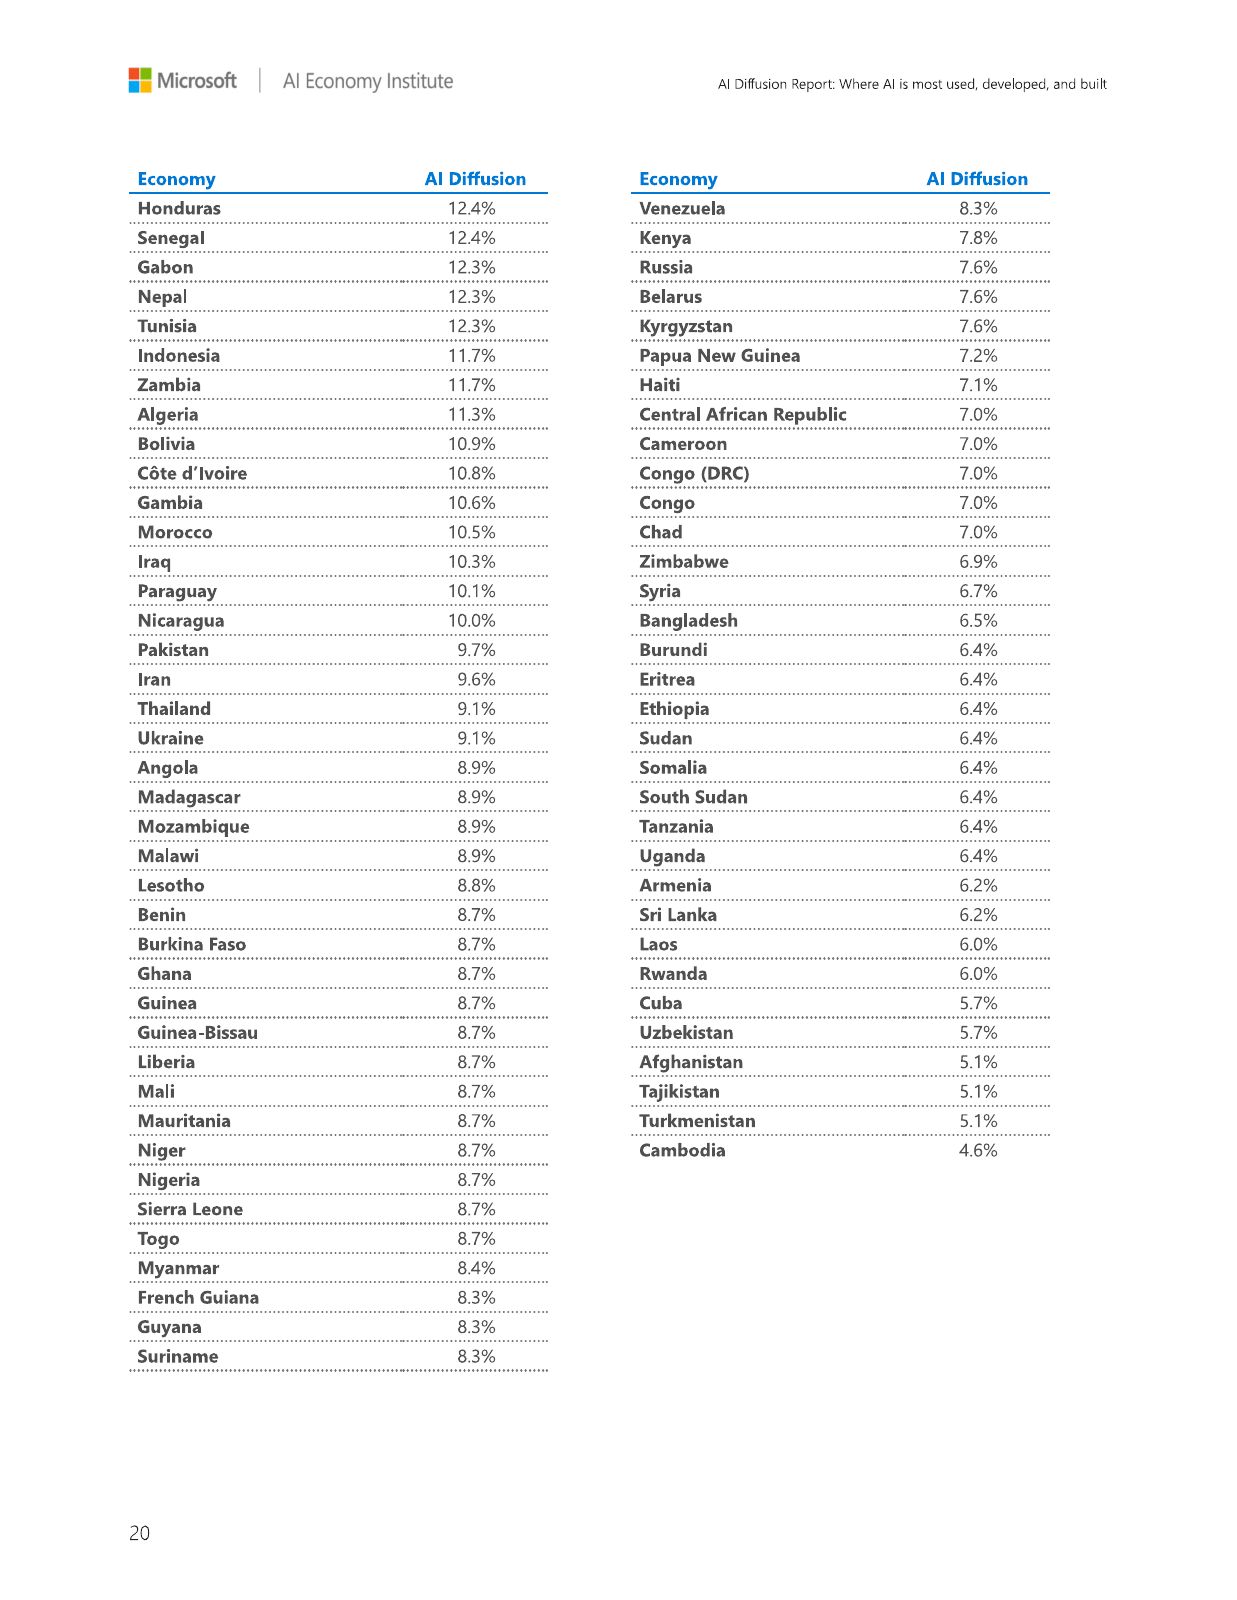

Global · H2 2025
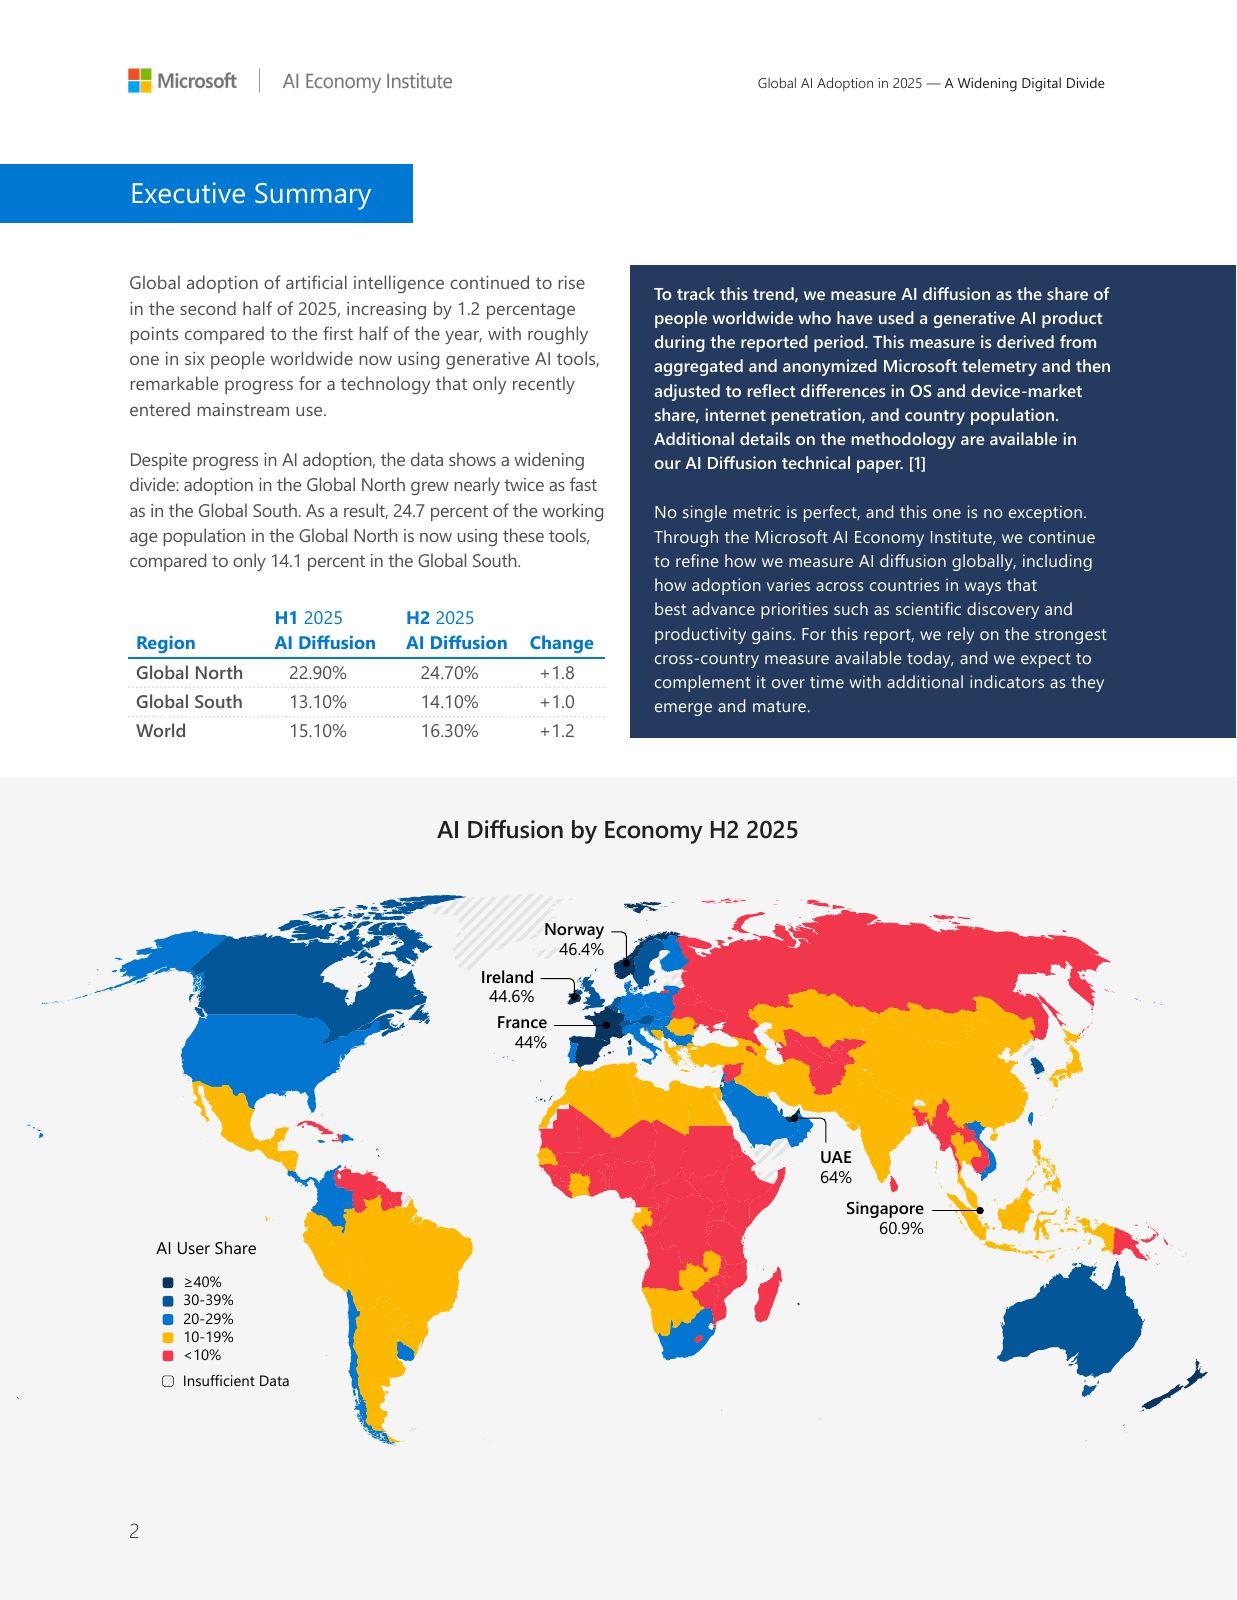
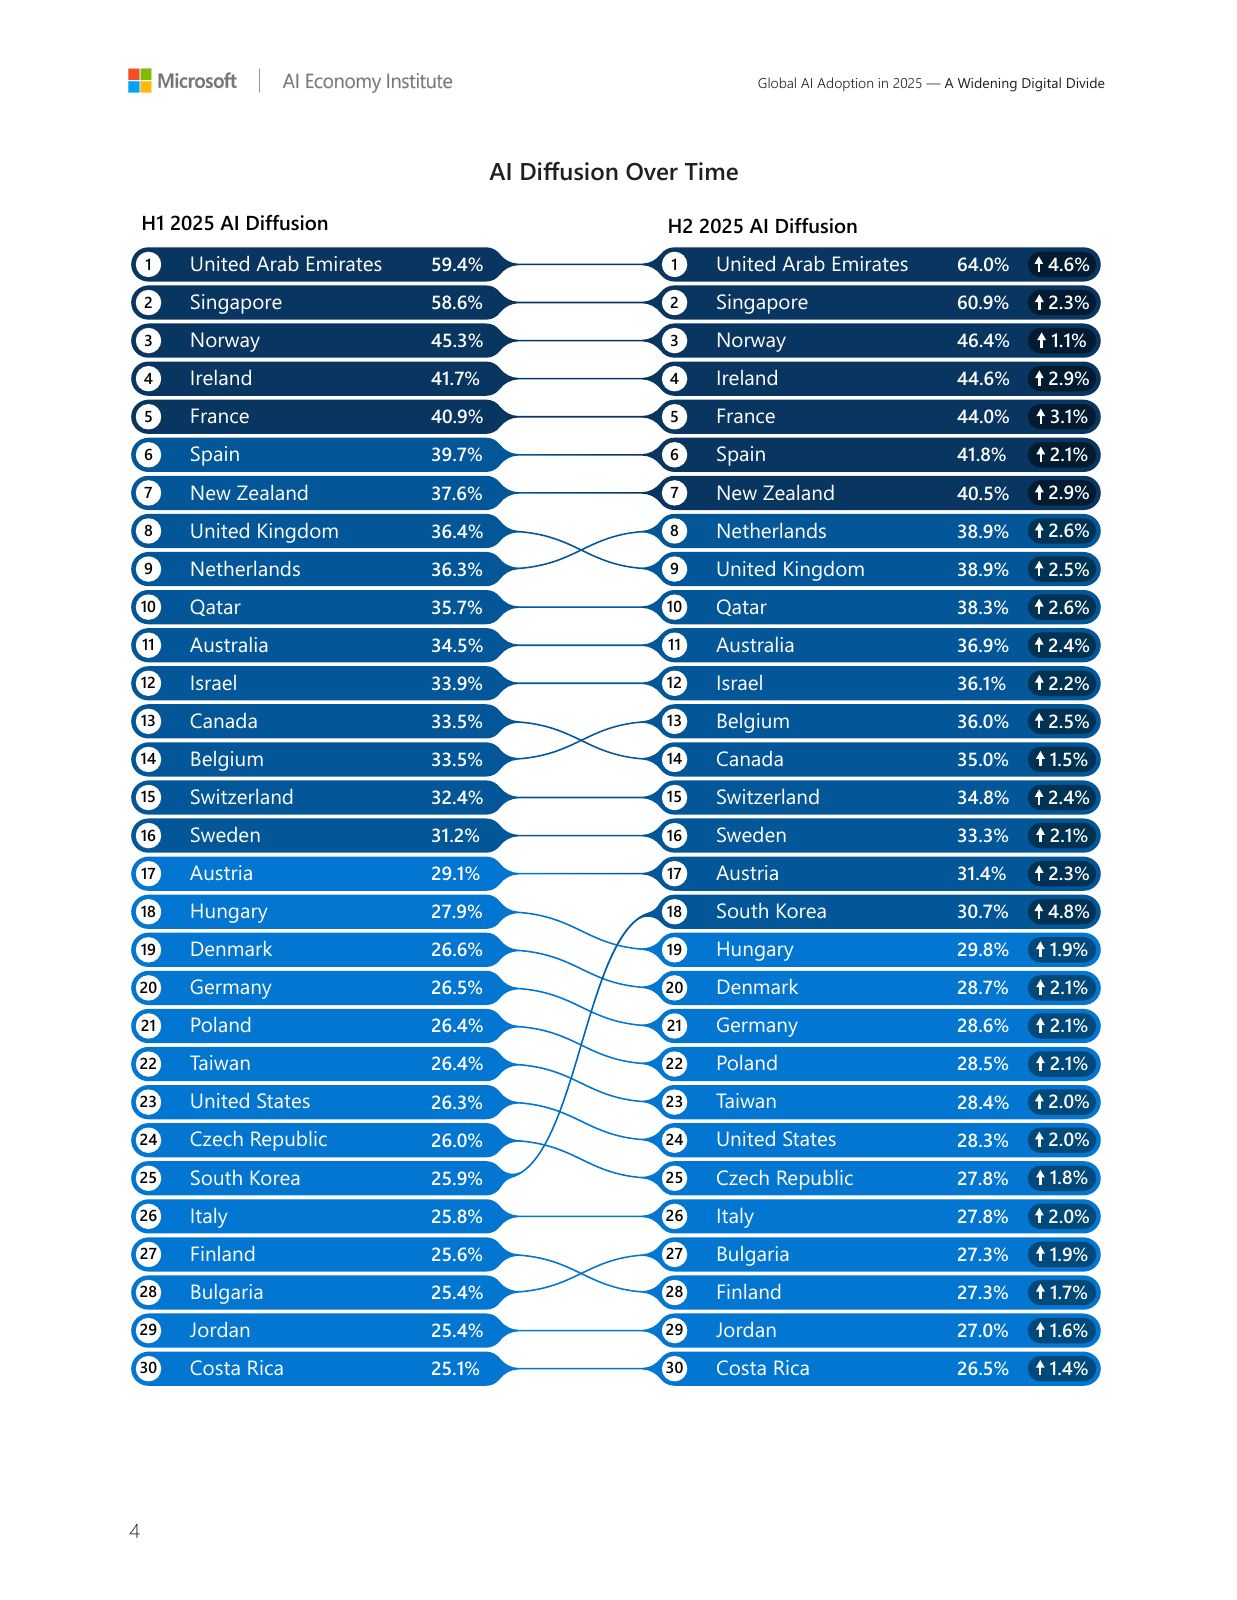
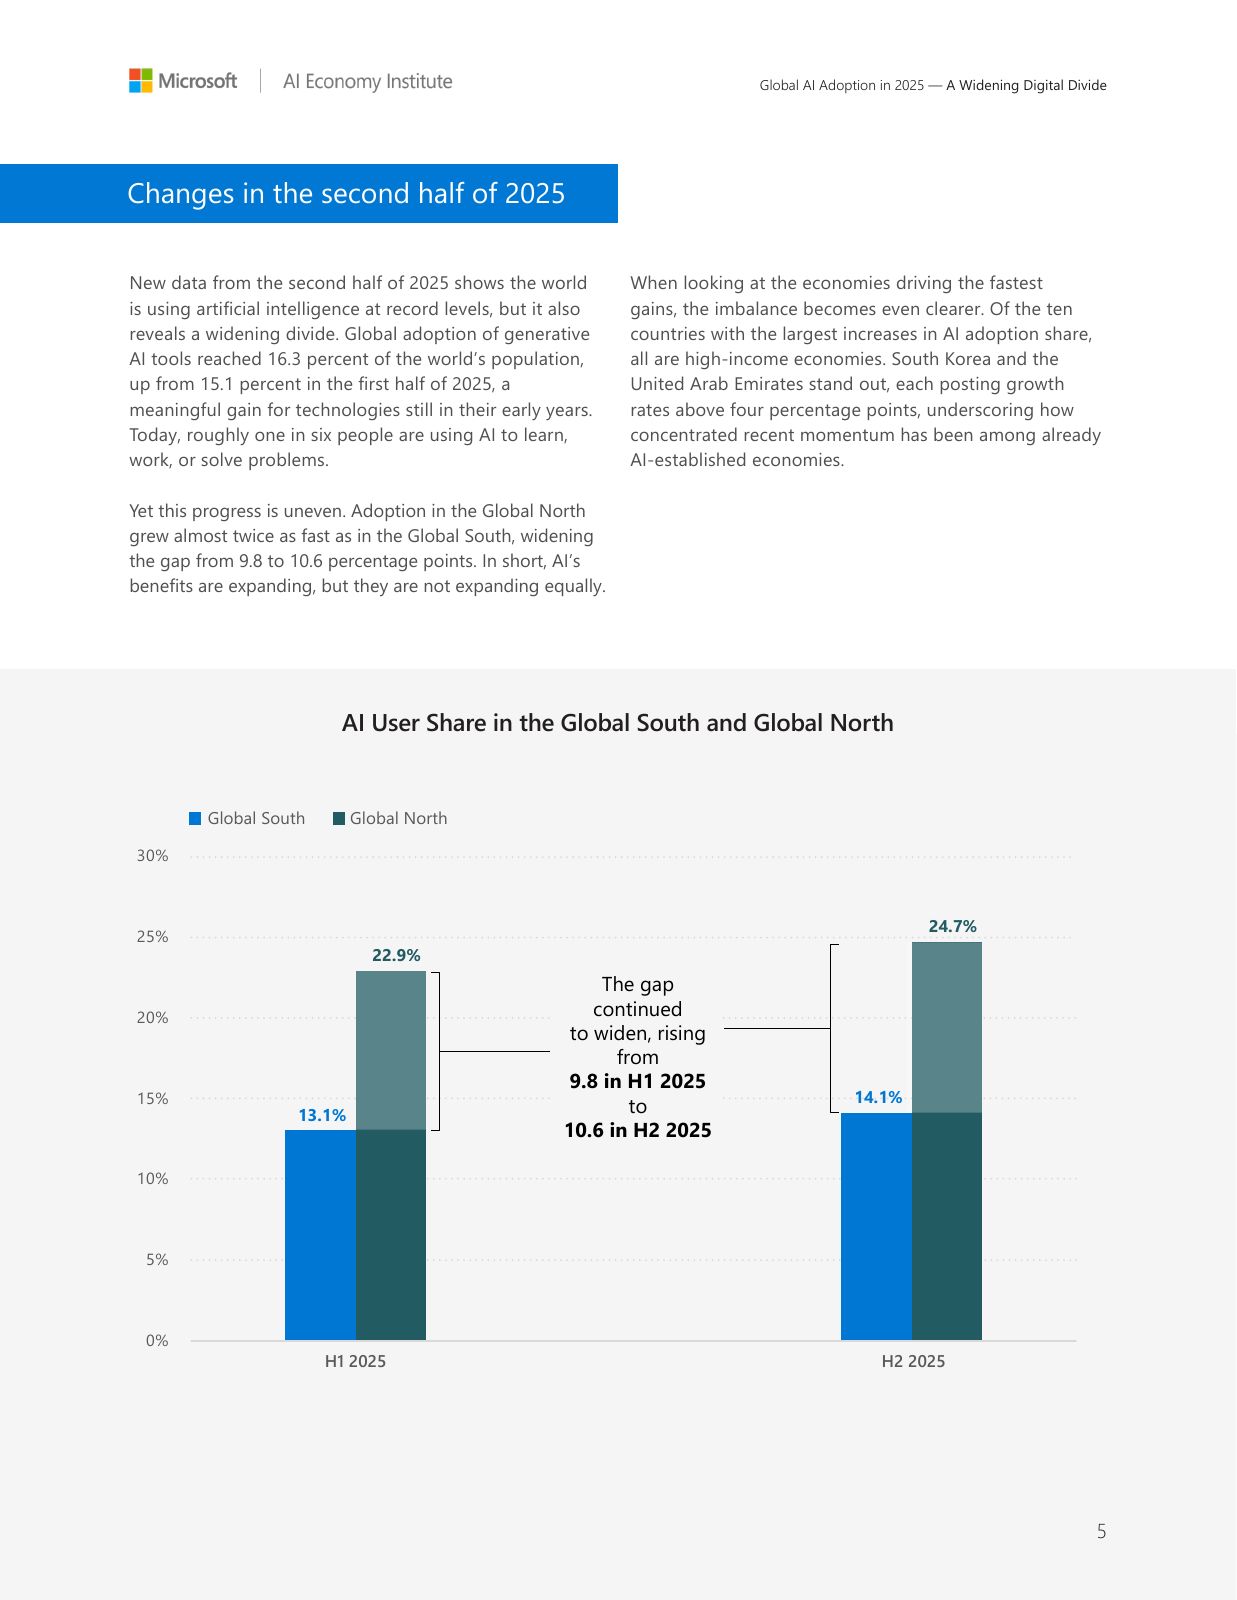
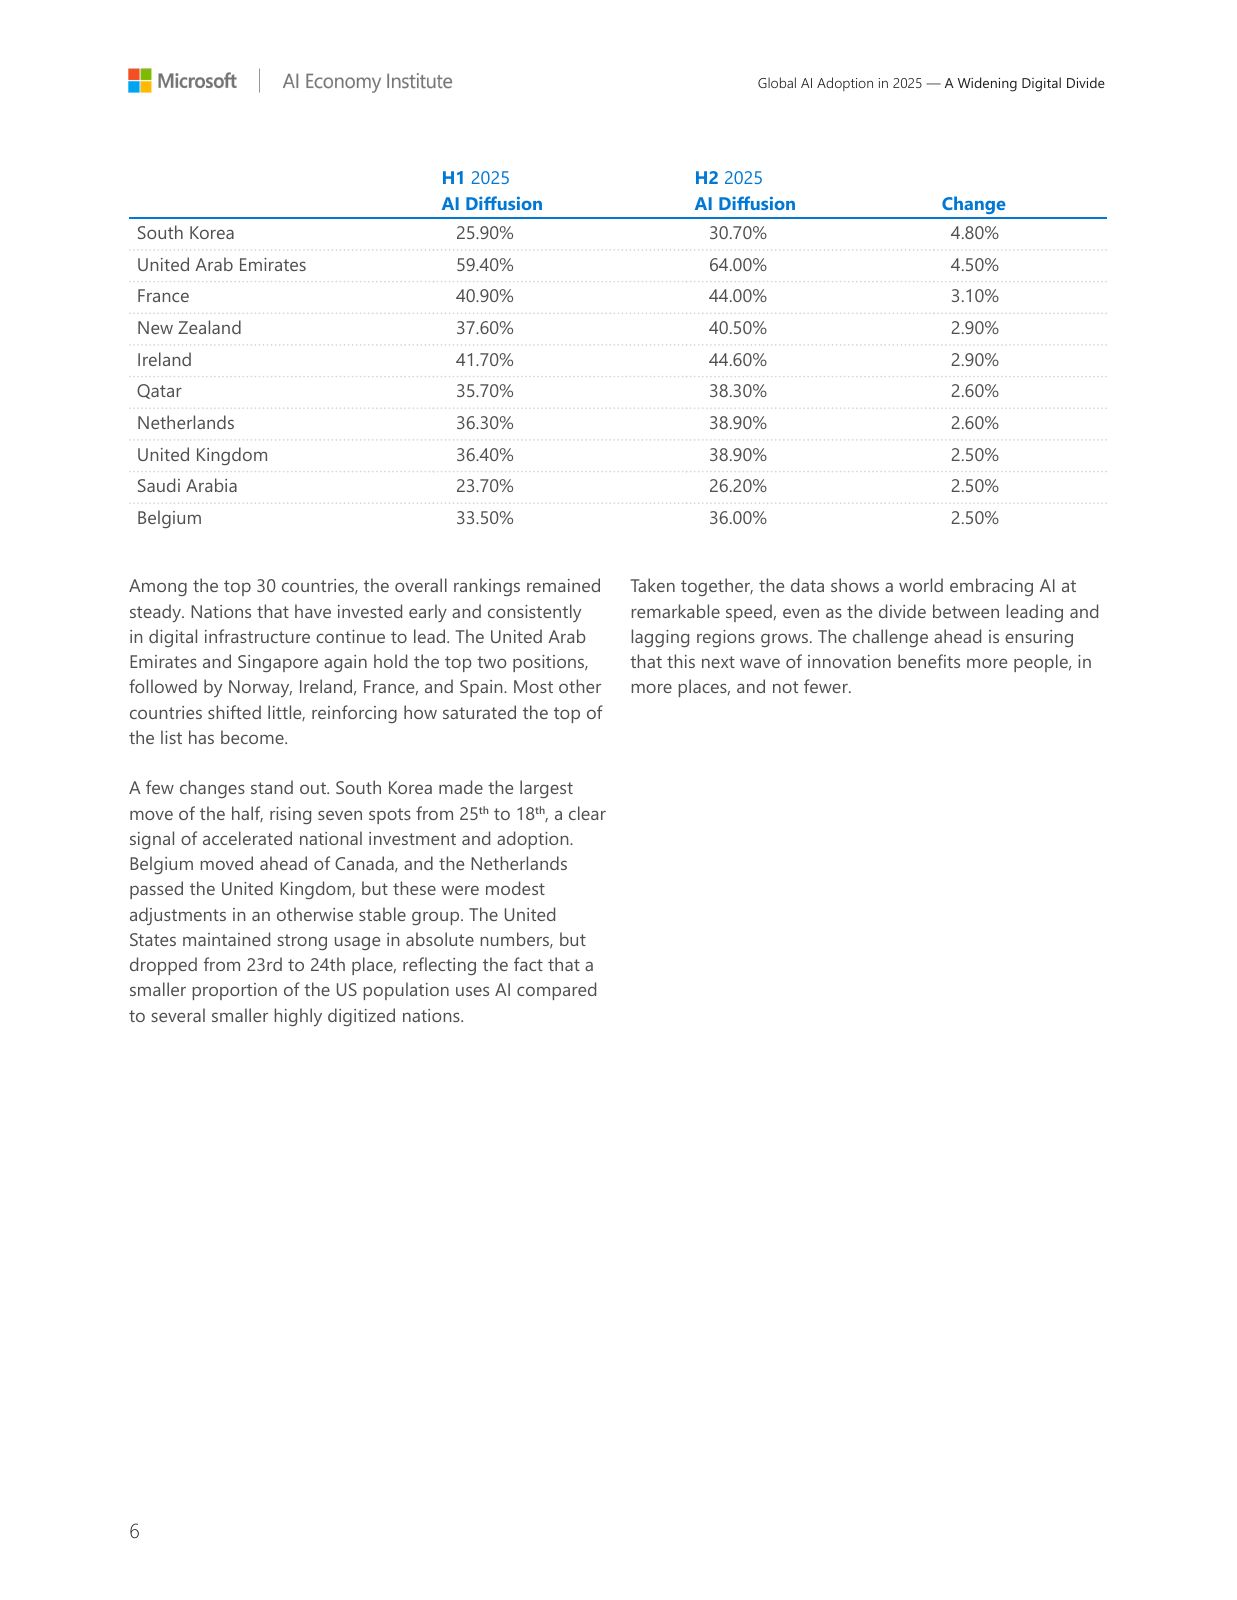
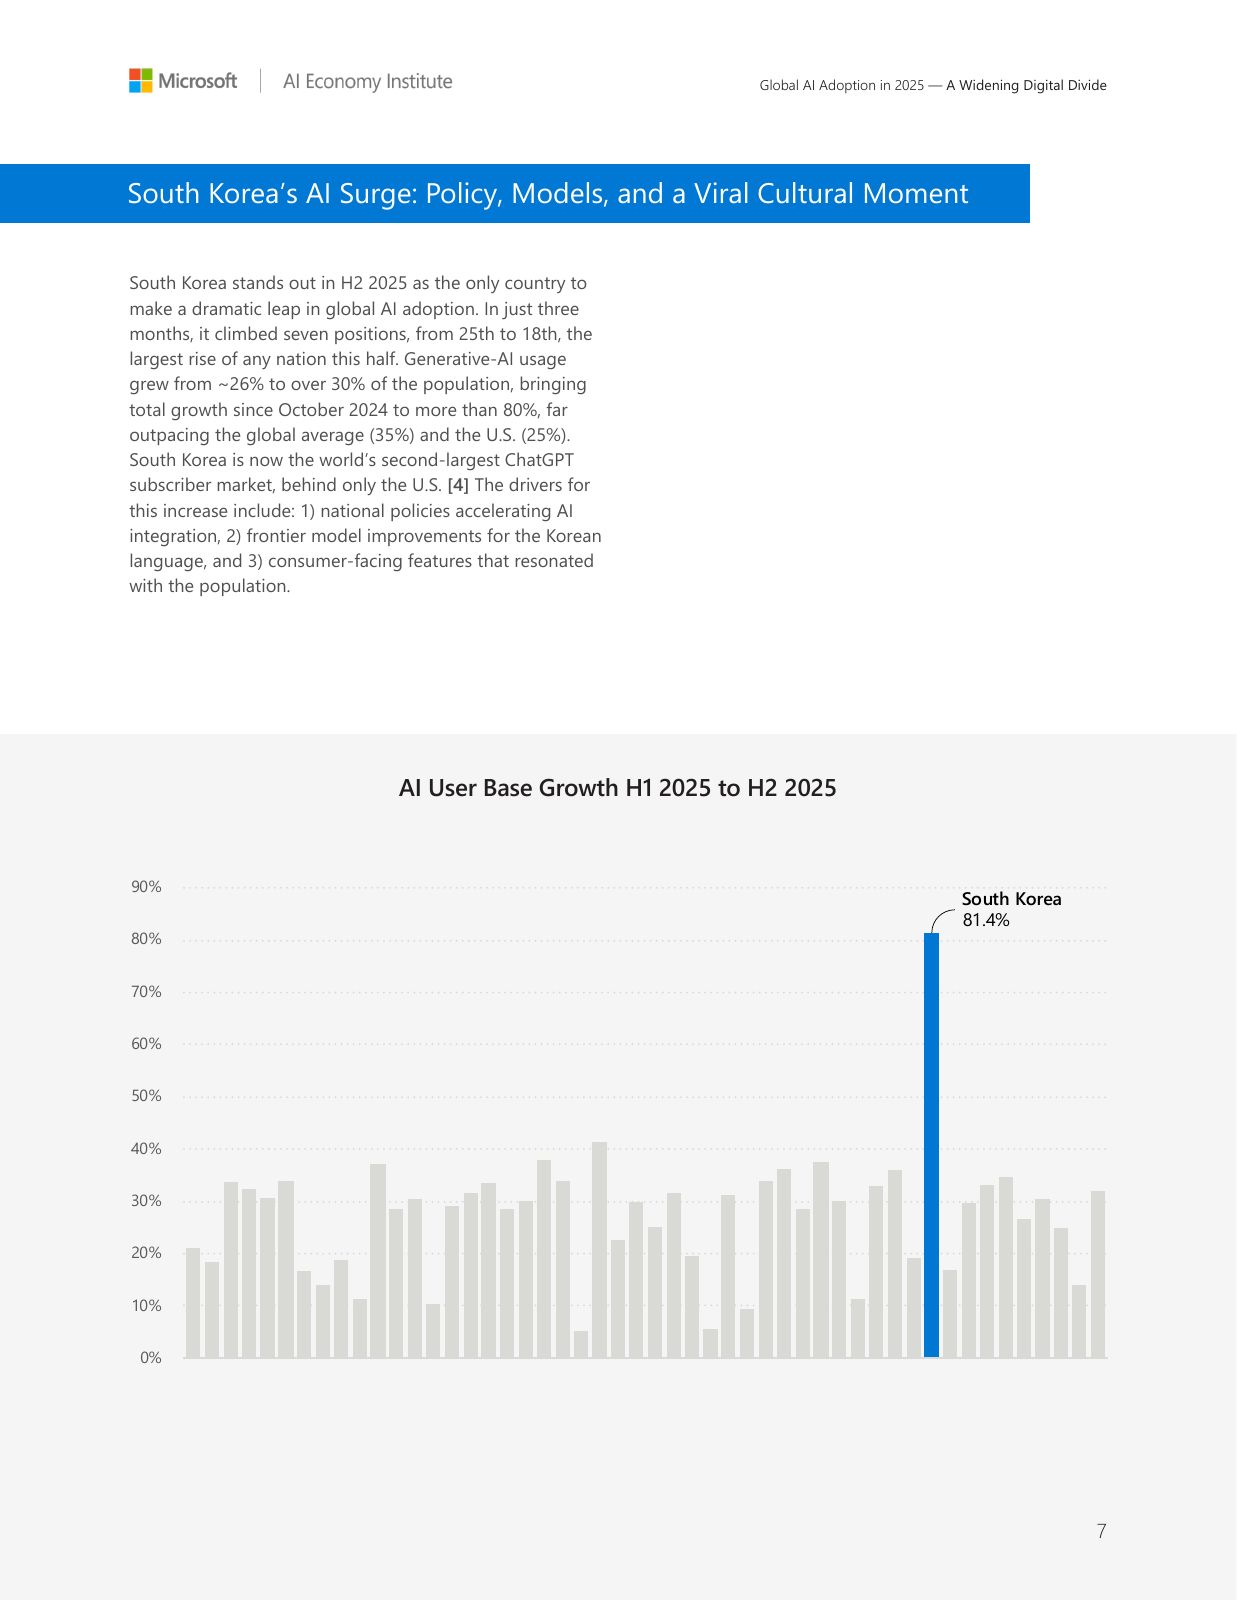
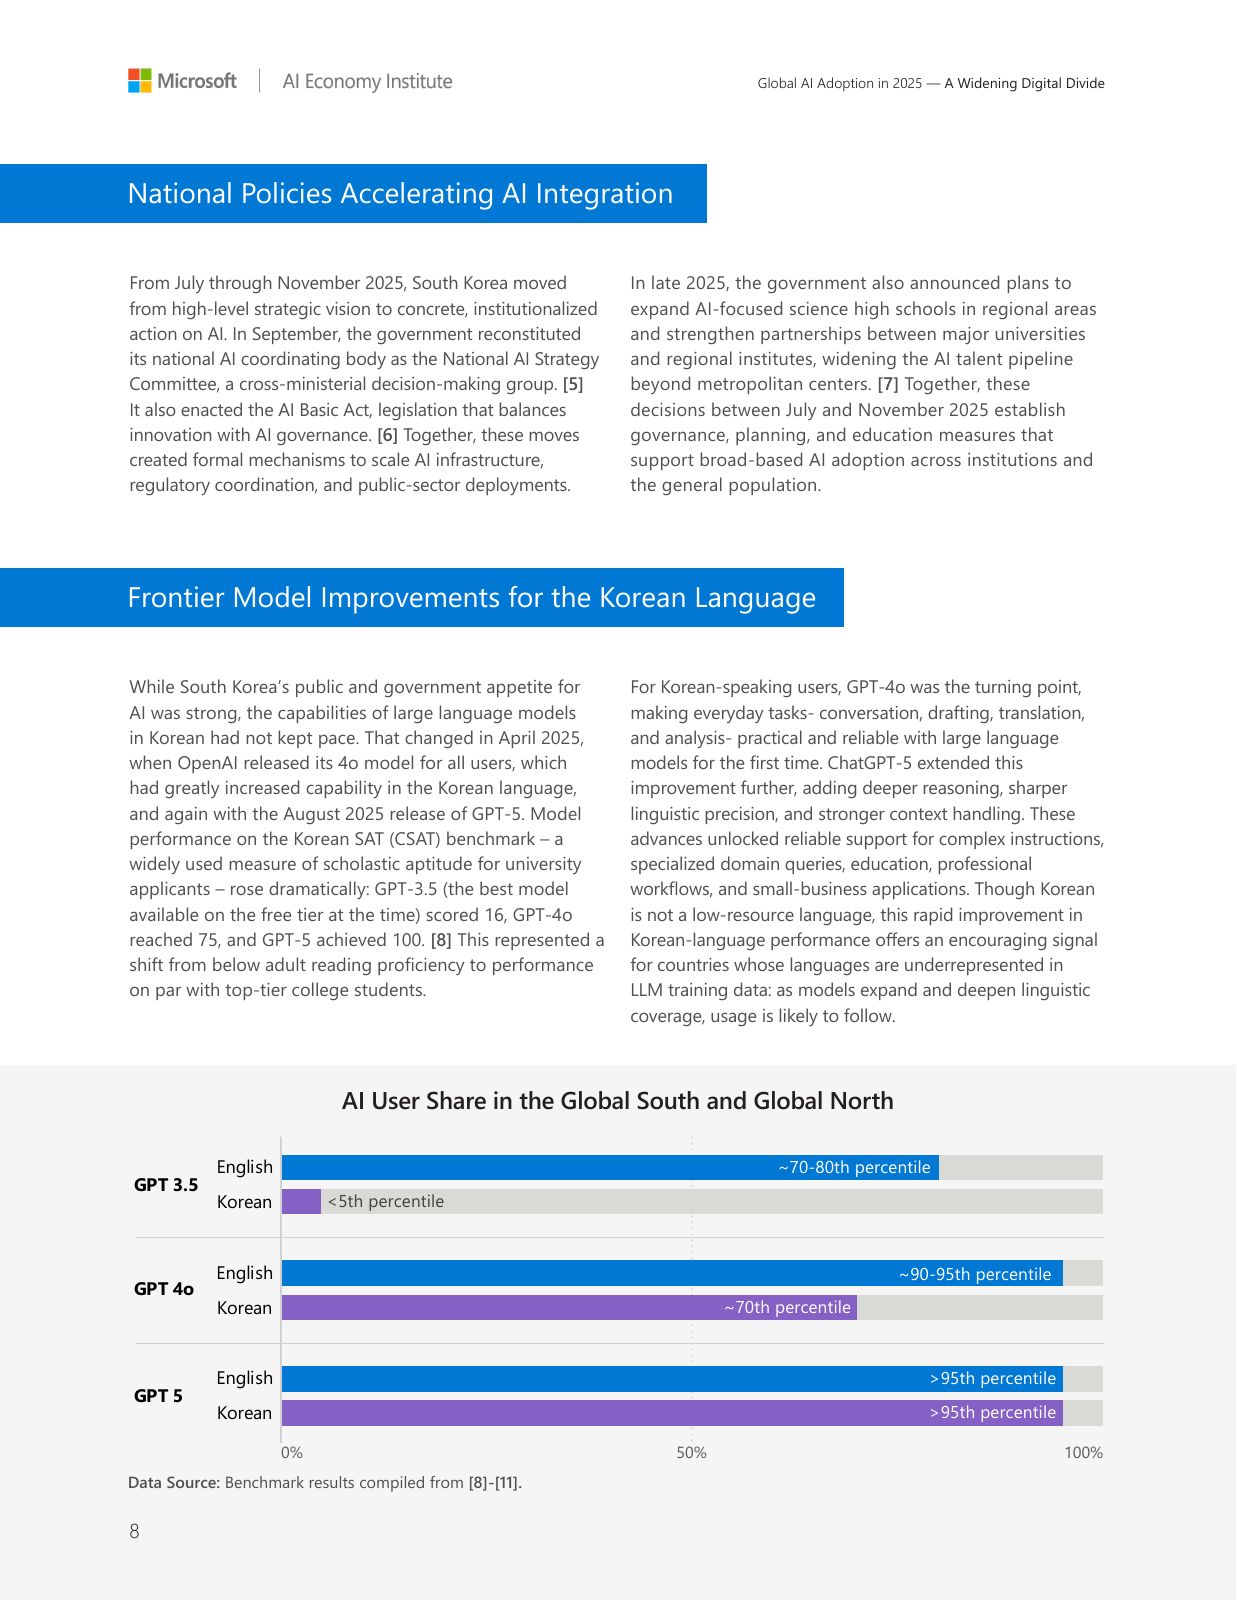
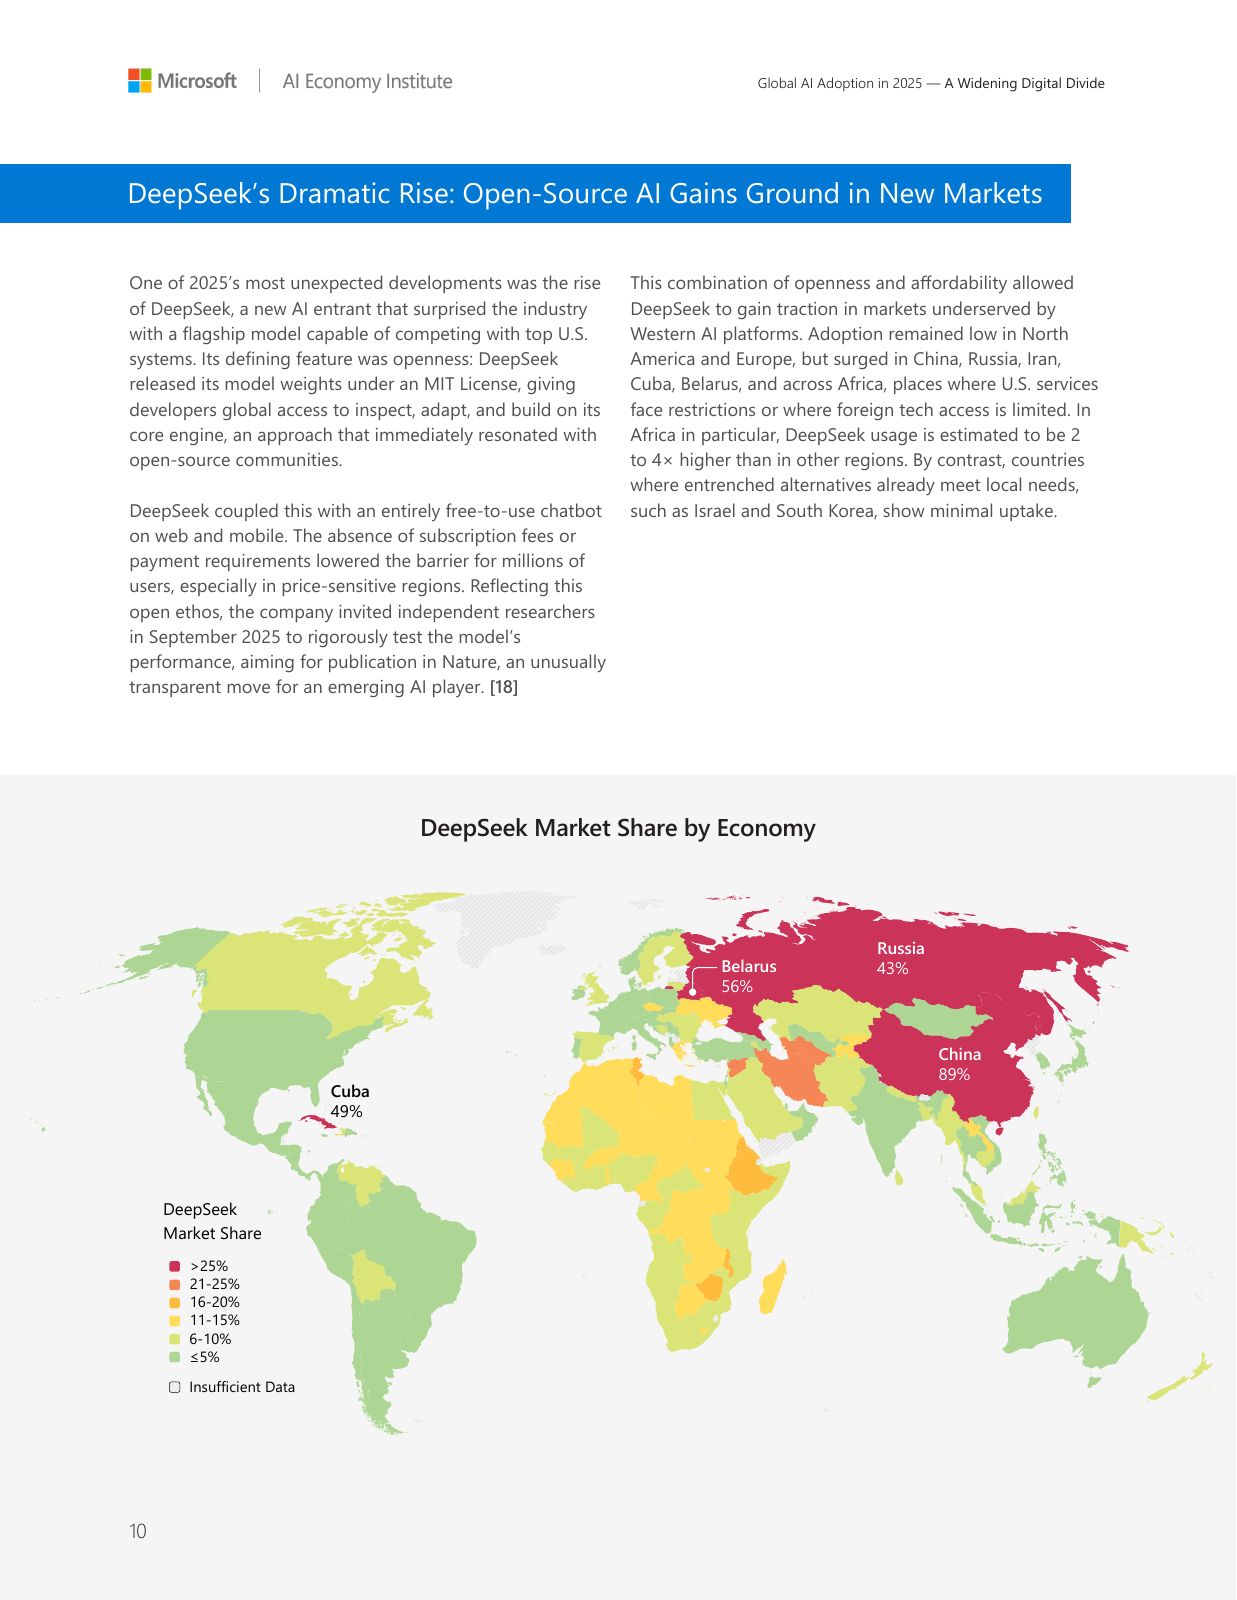
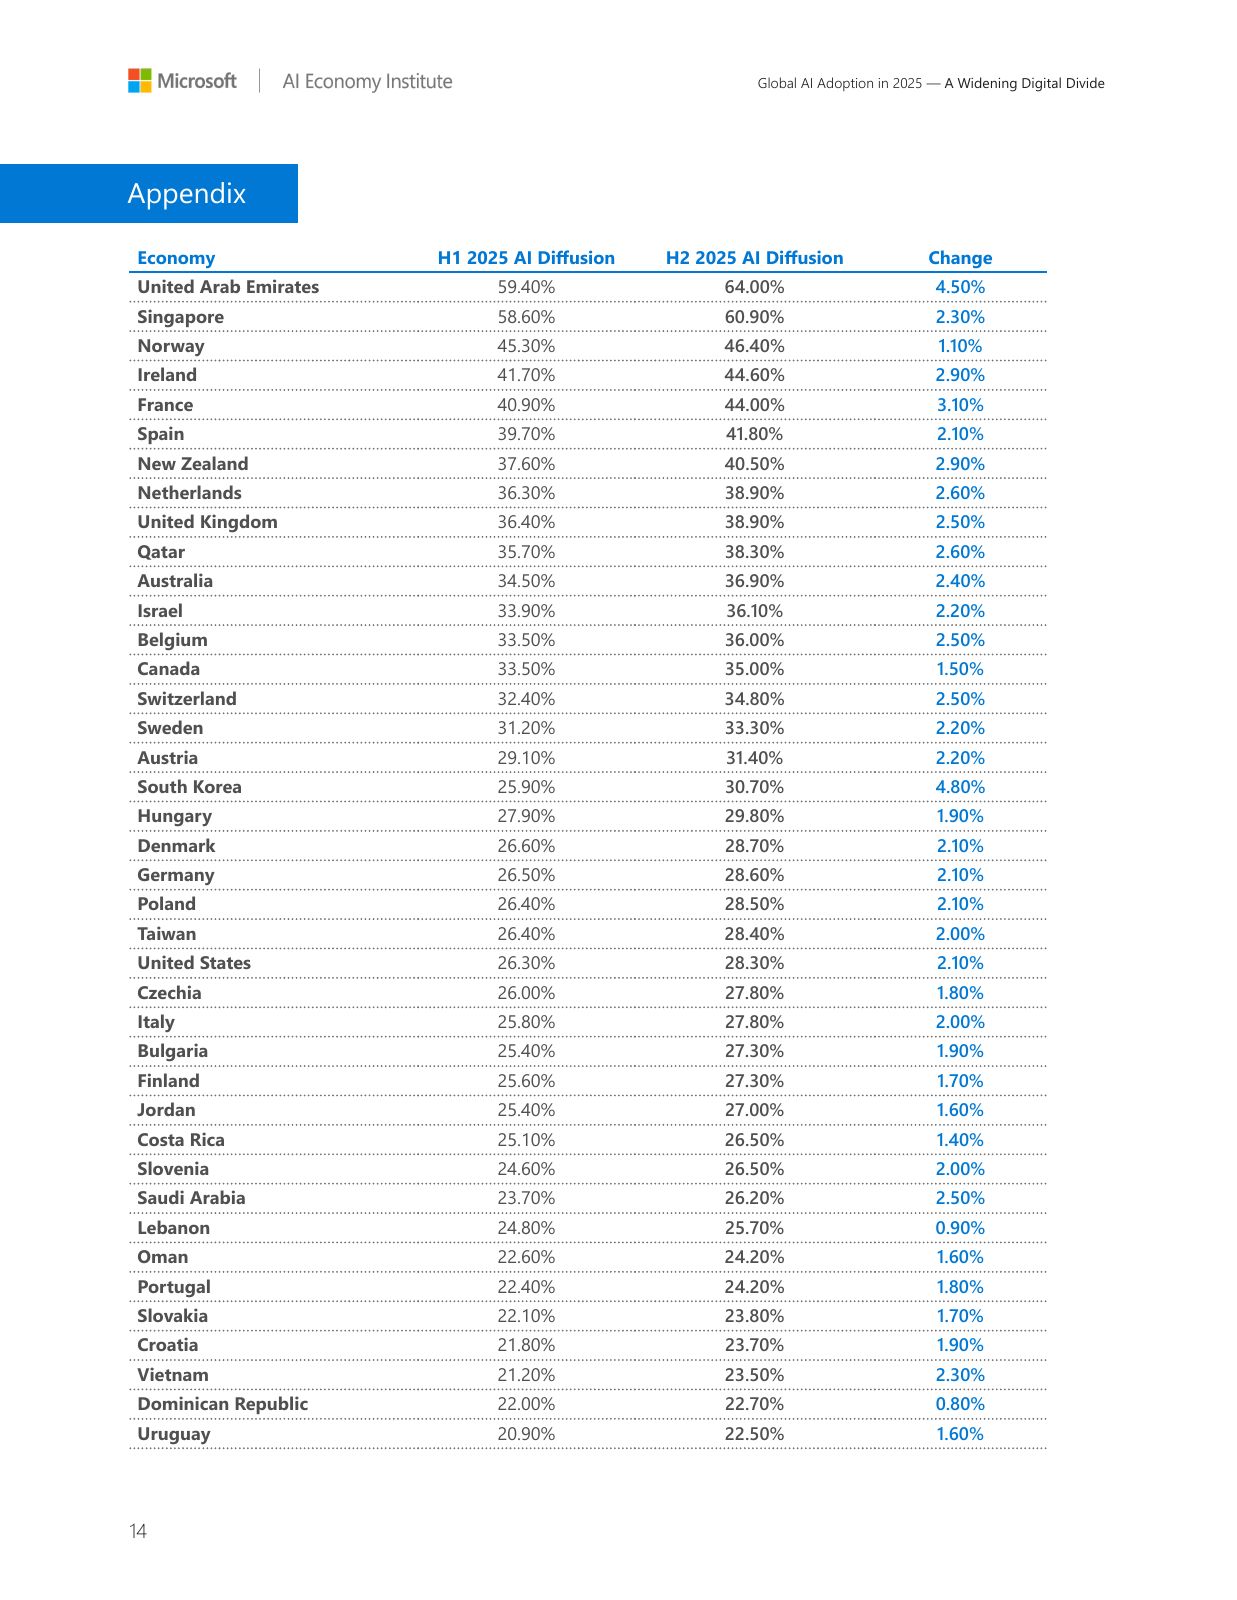
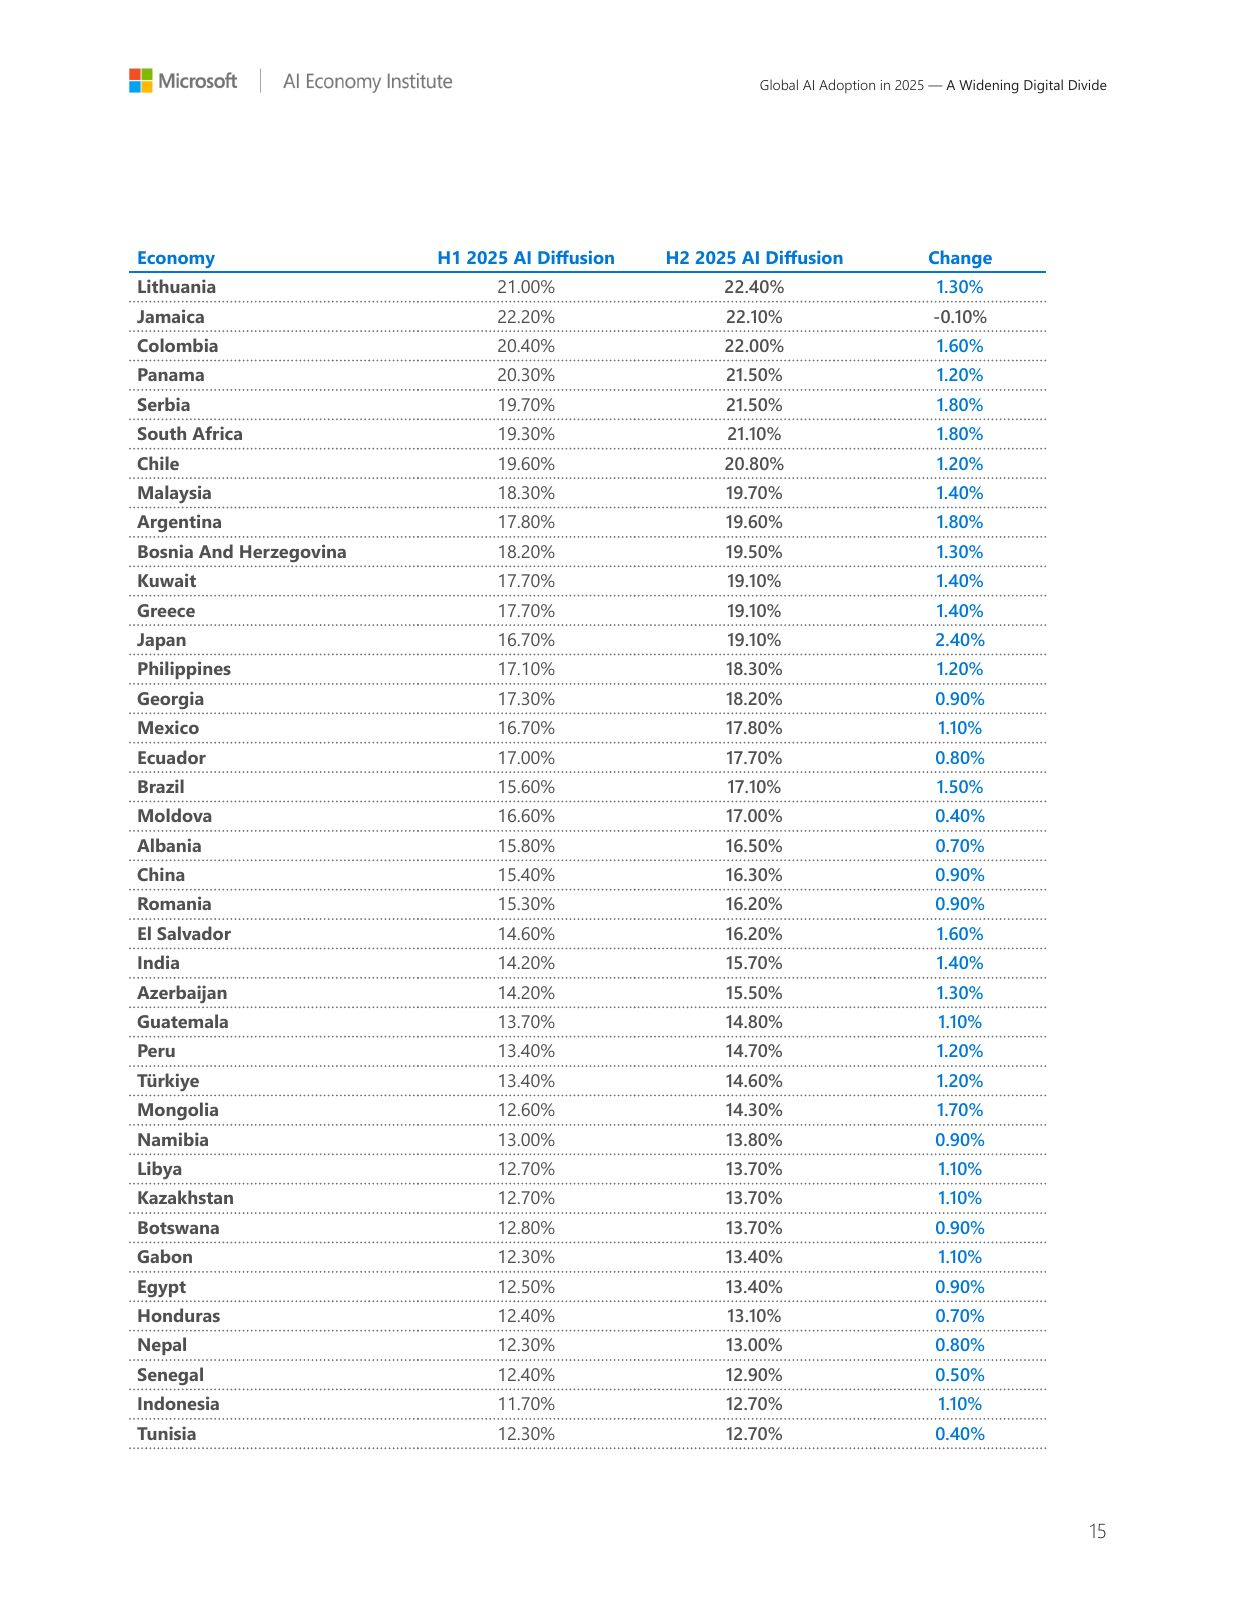
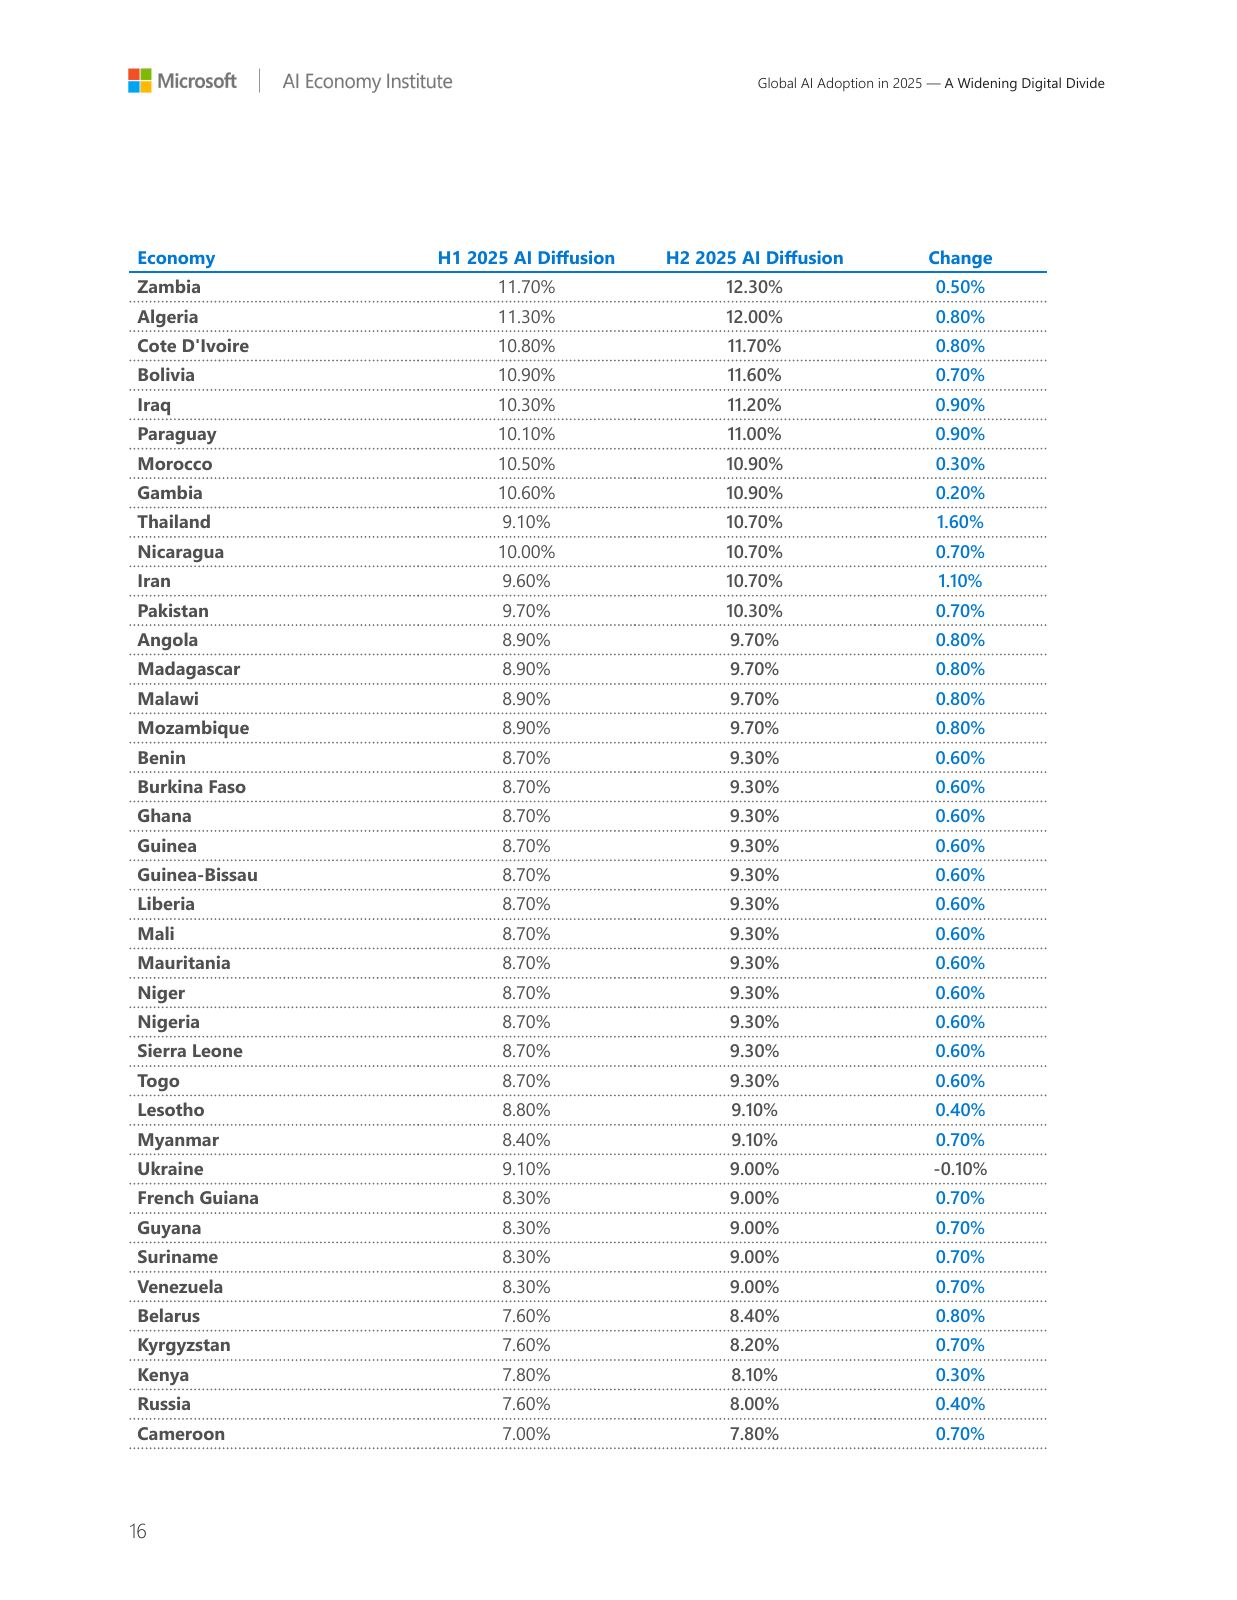
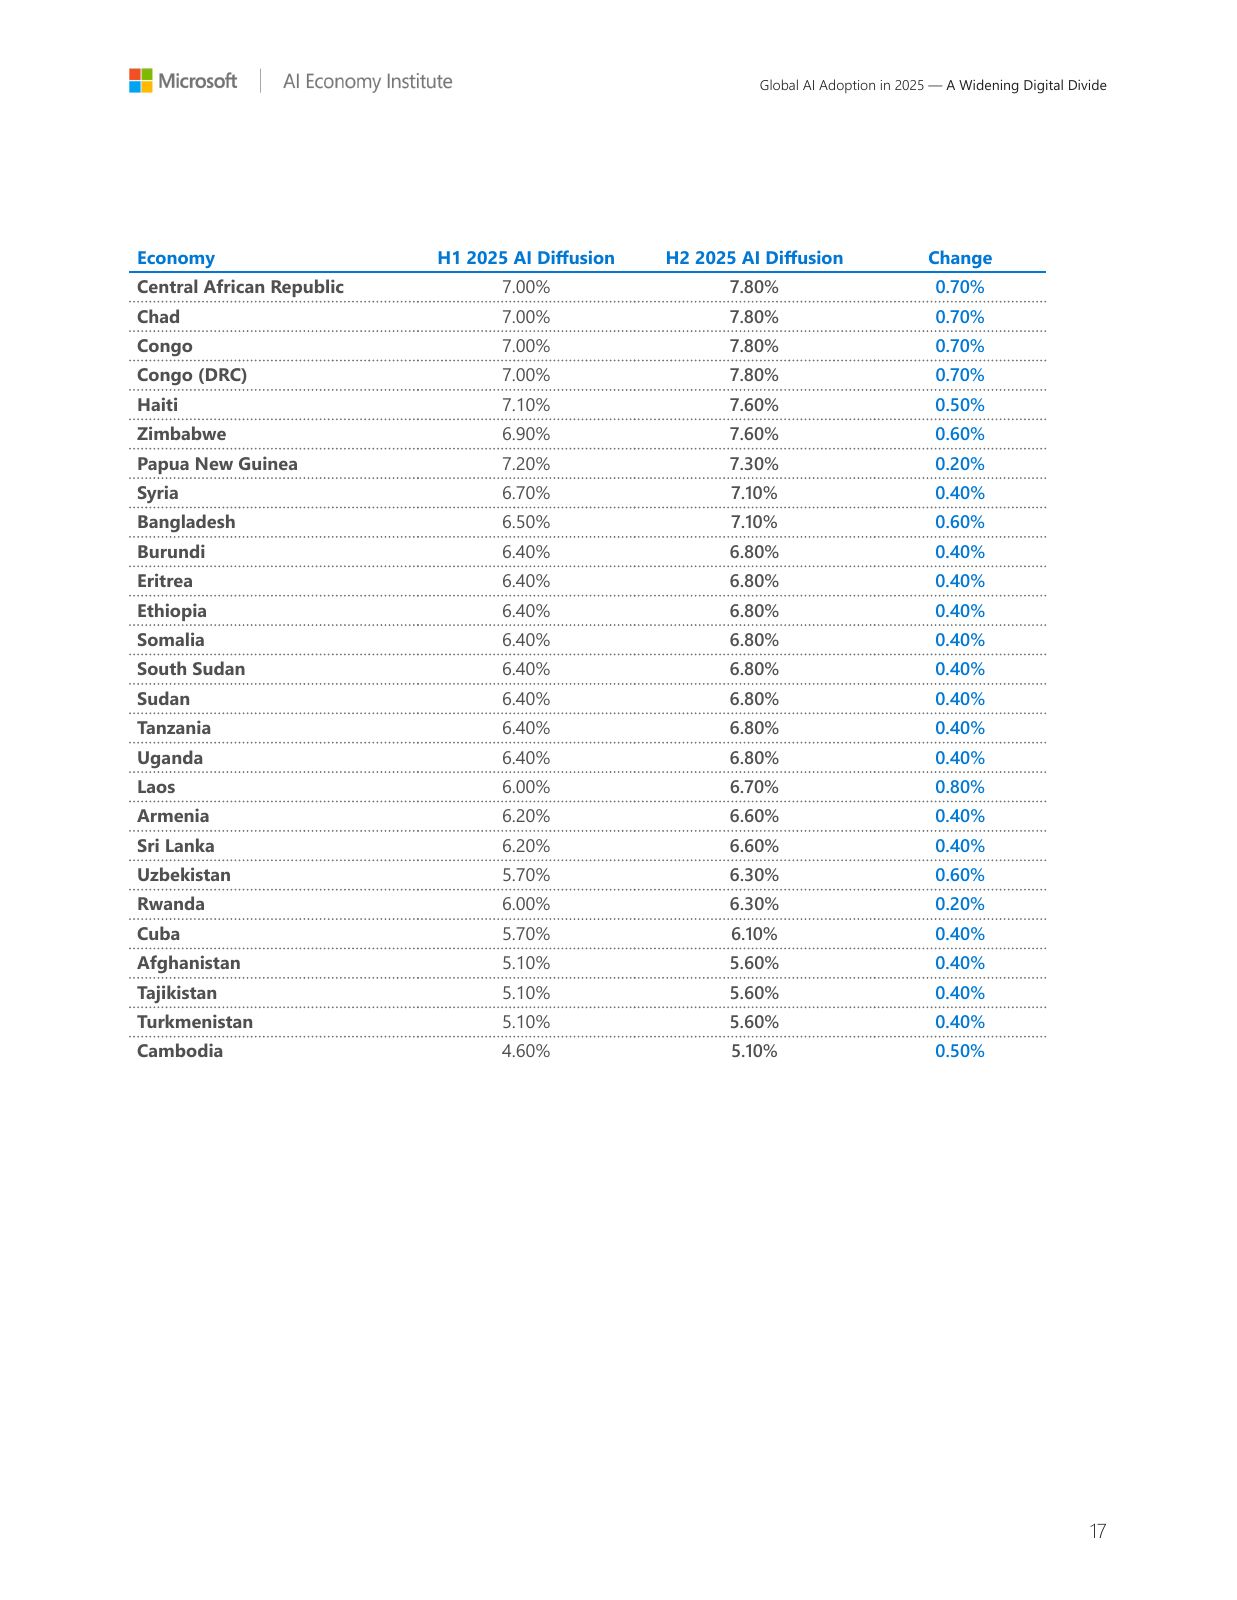

Global · Q1 2026
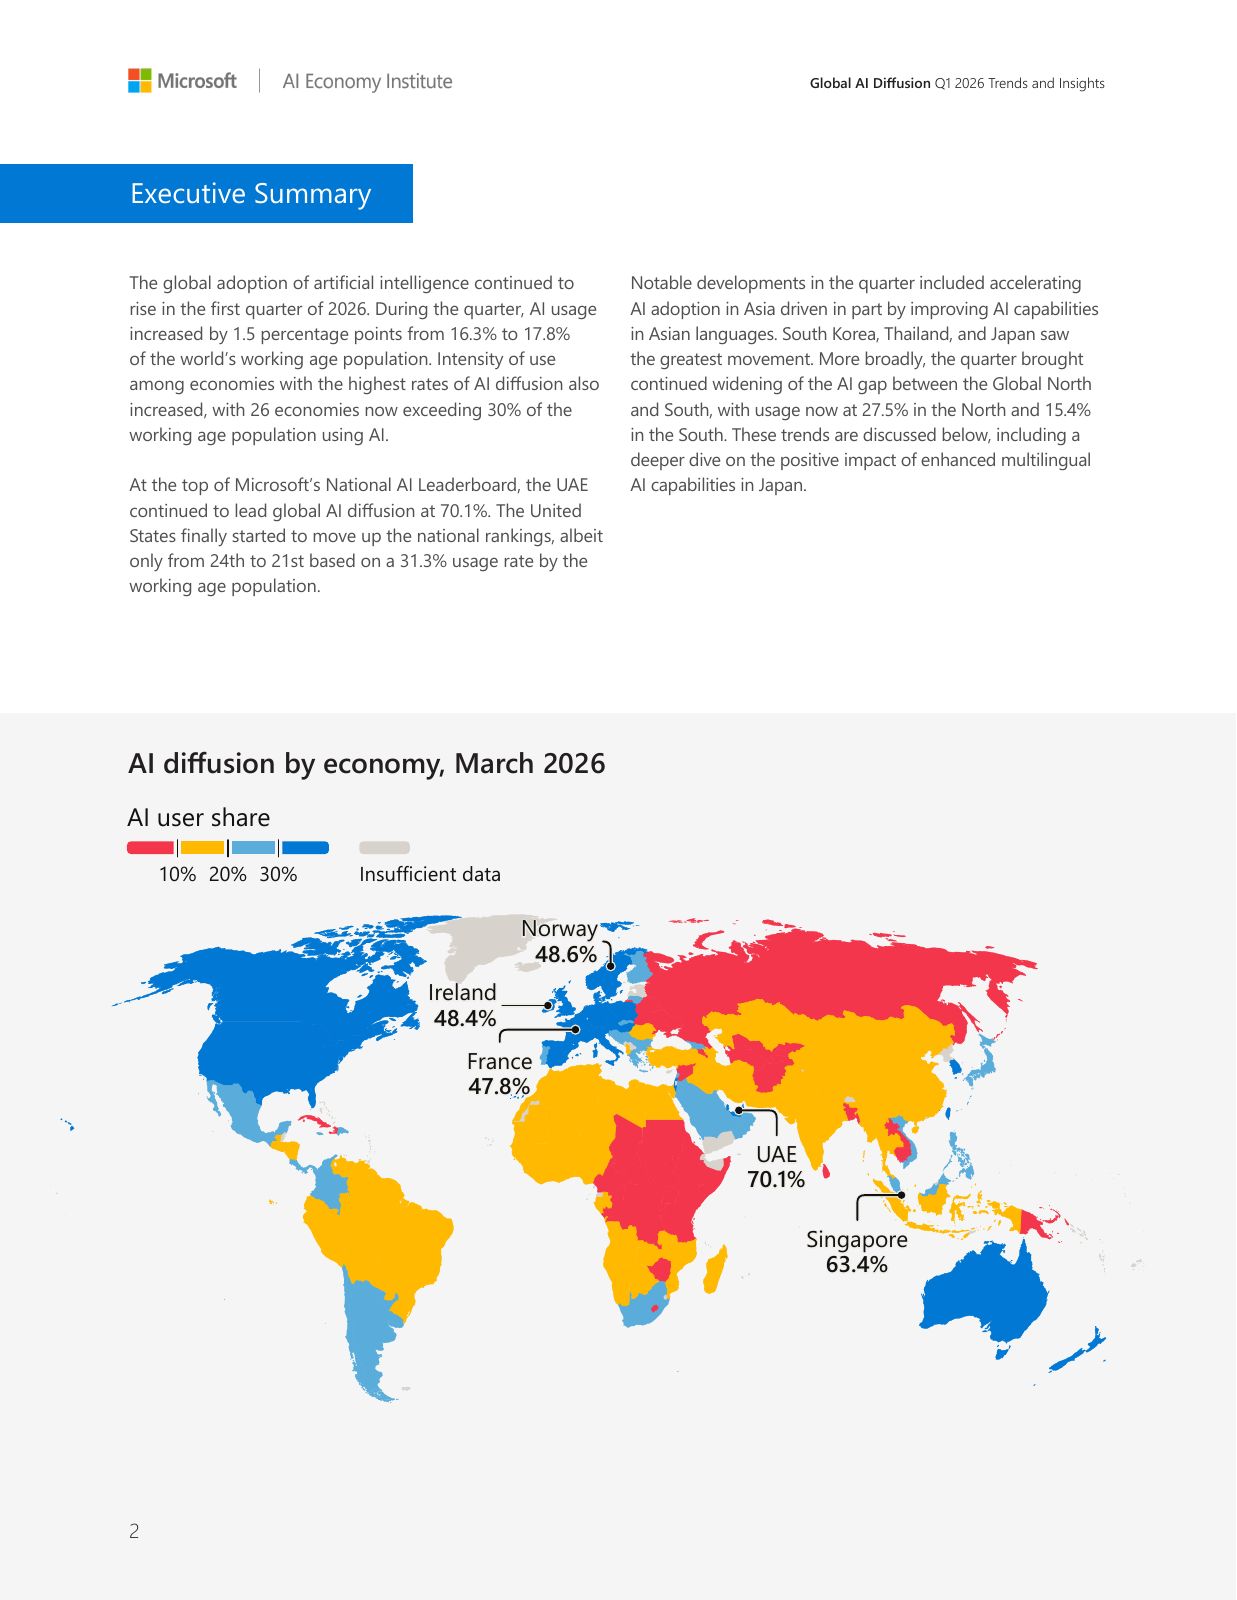
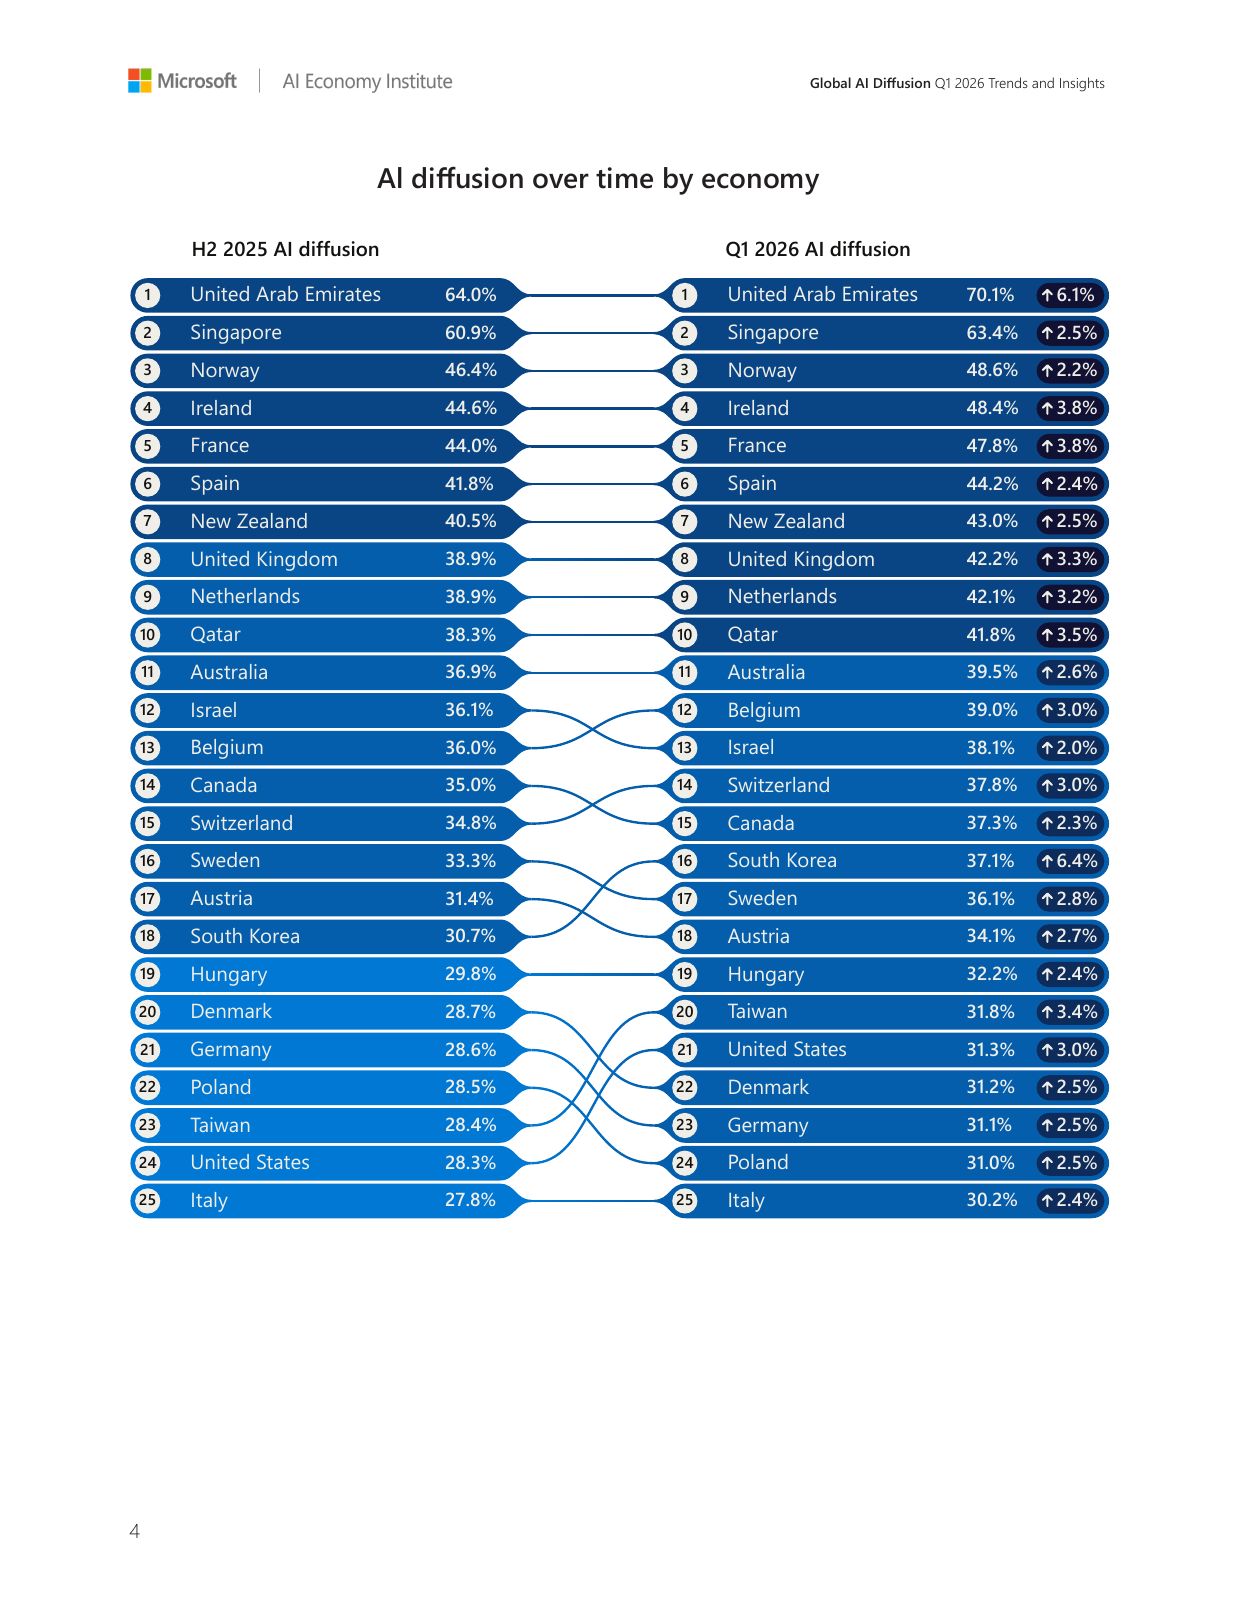
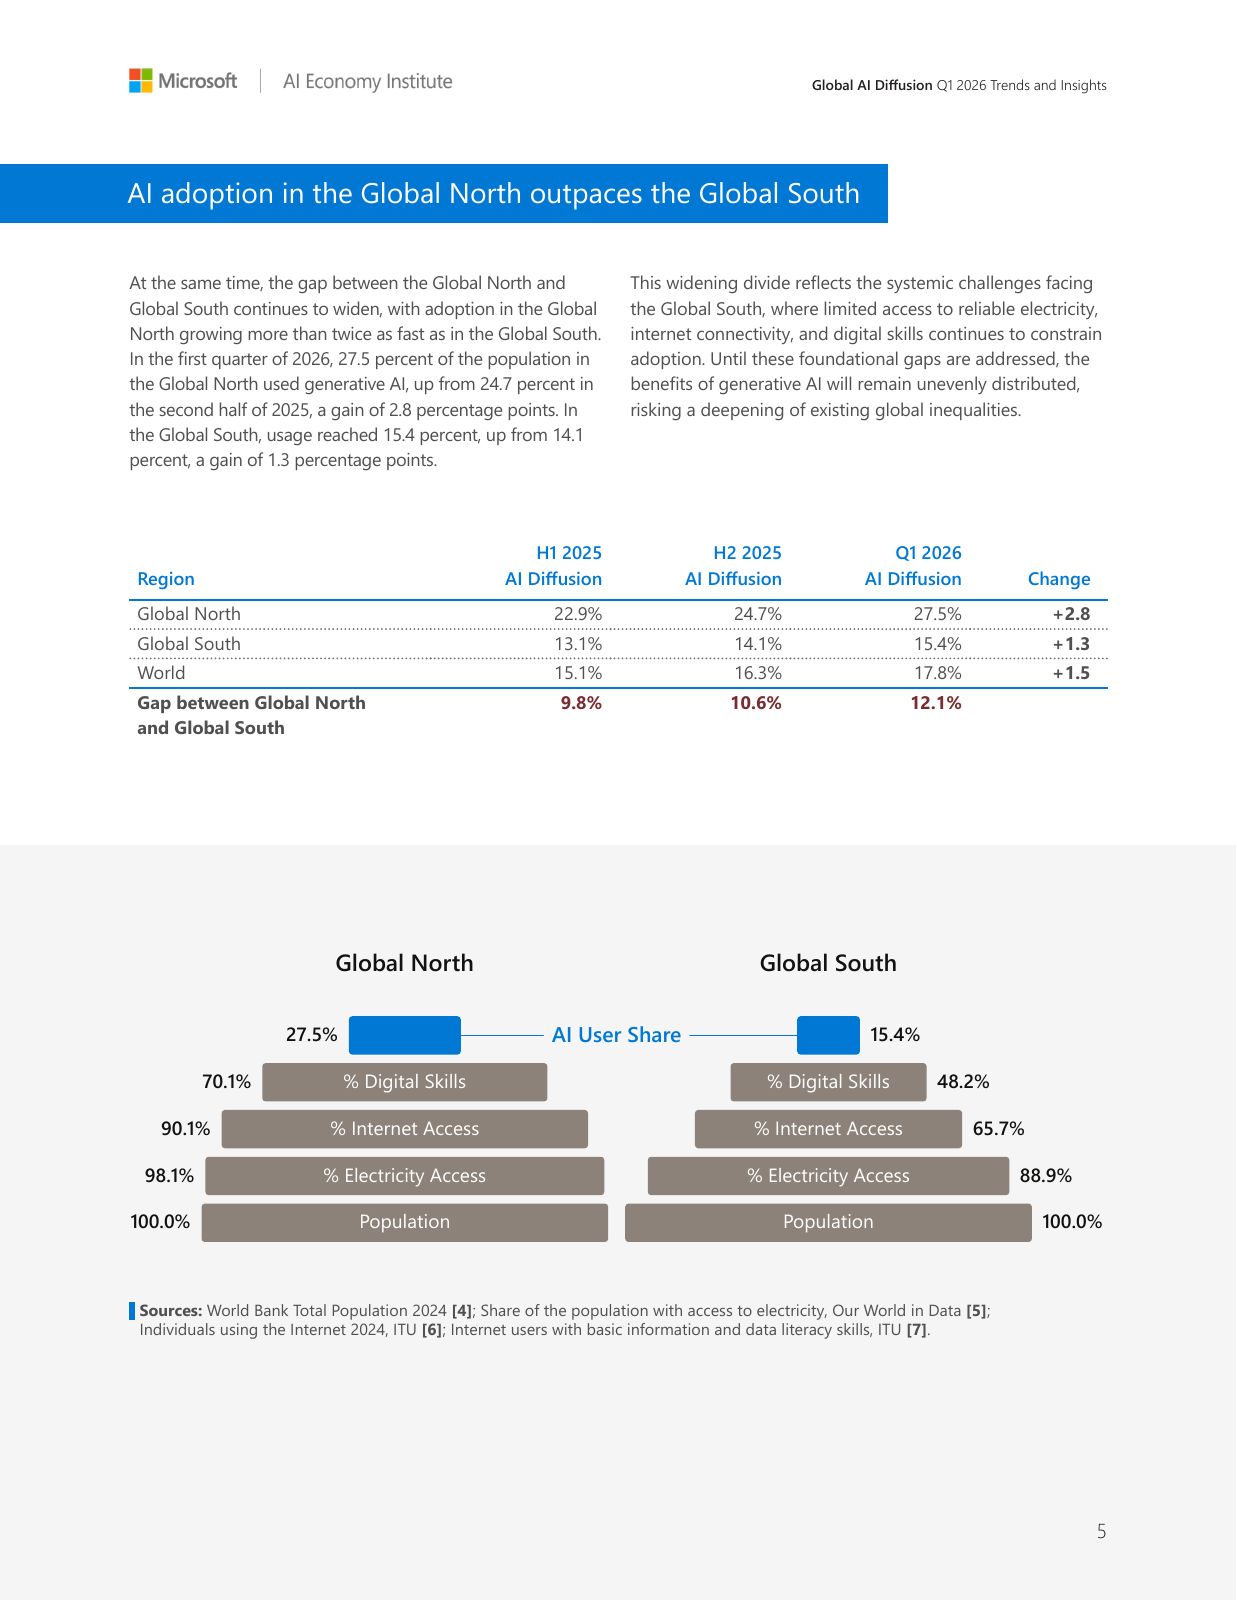
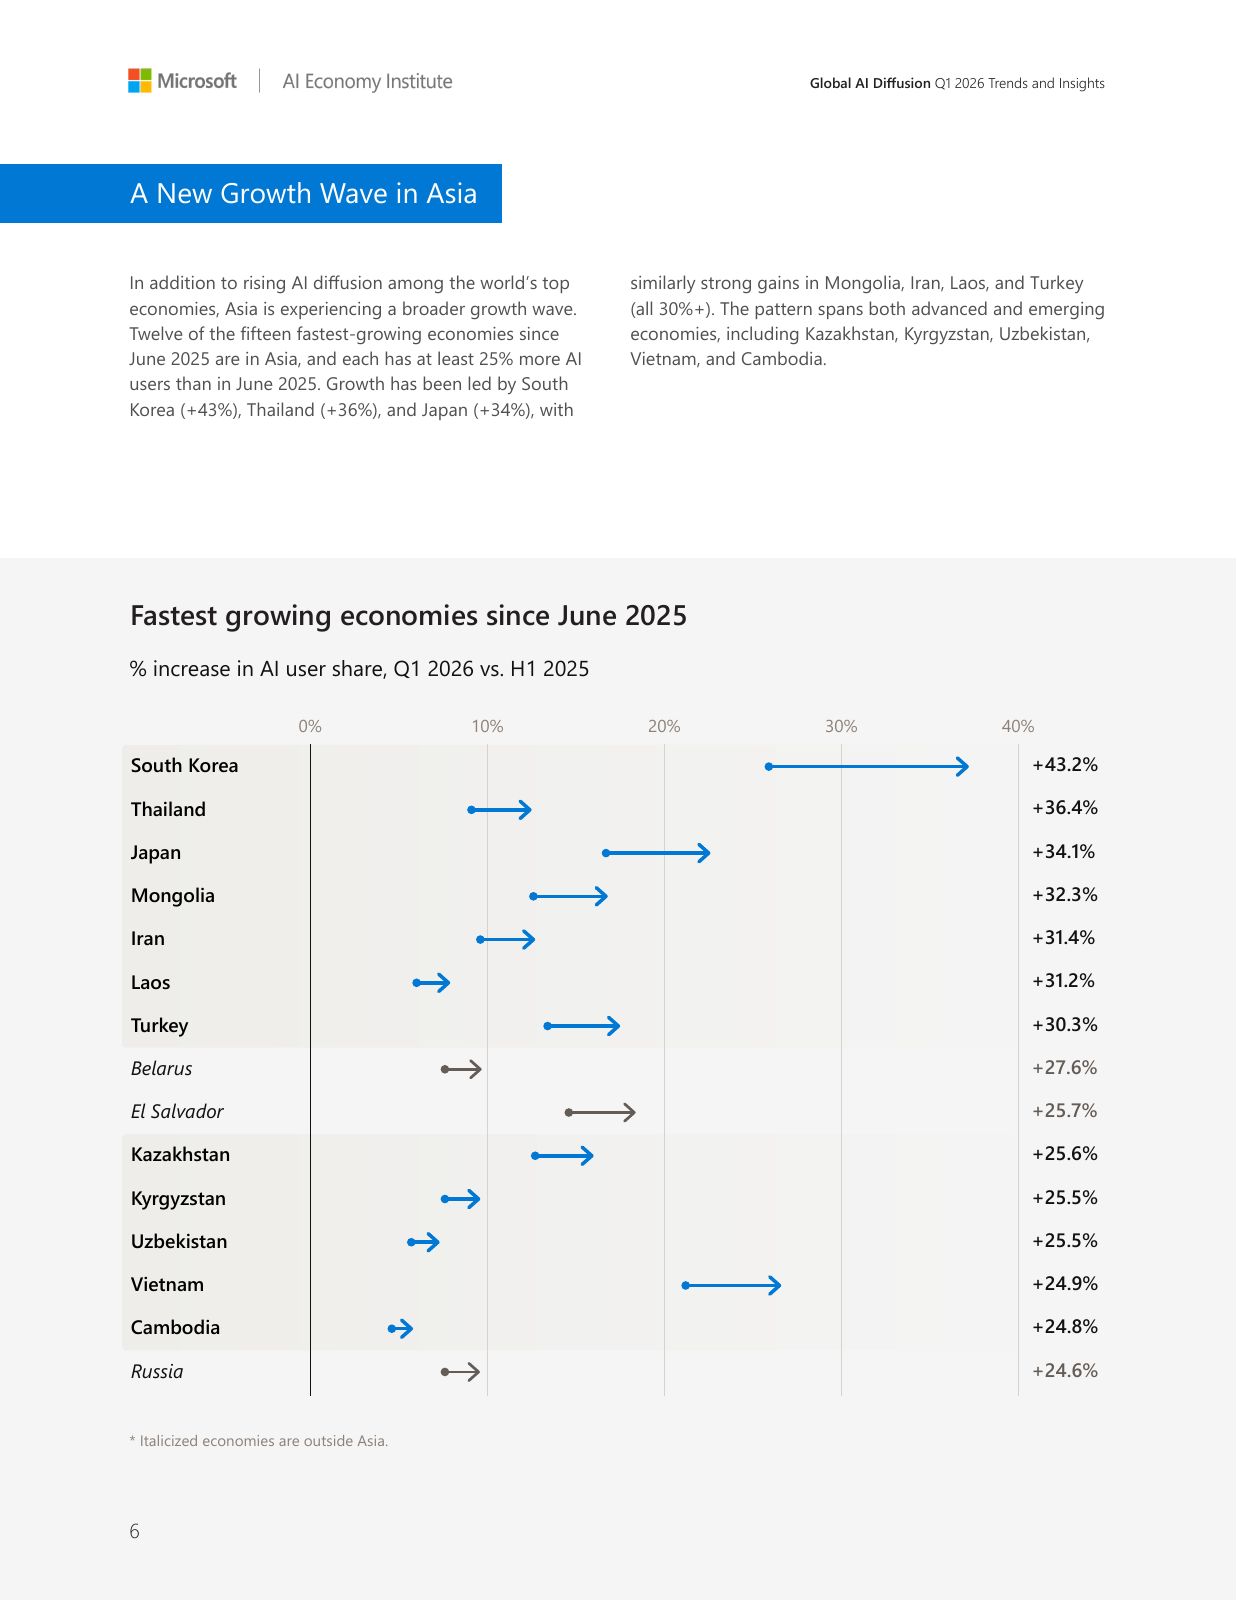
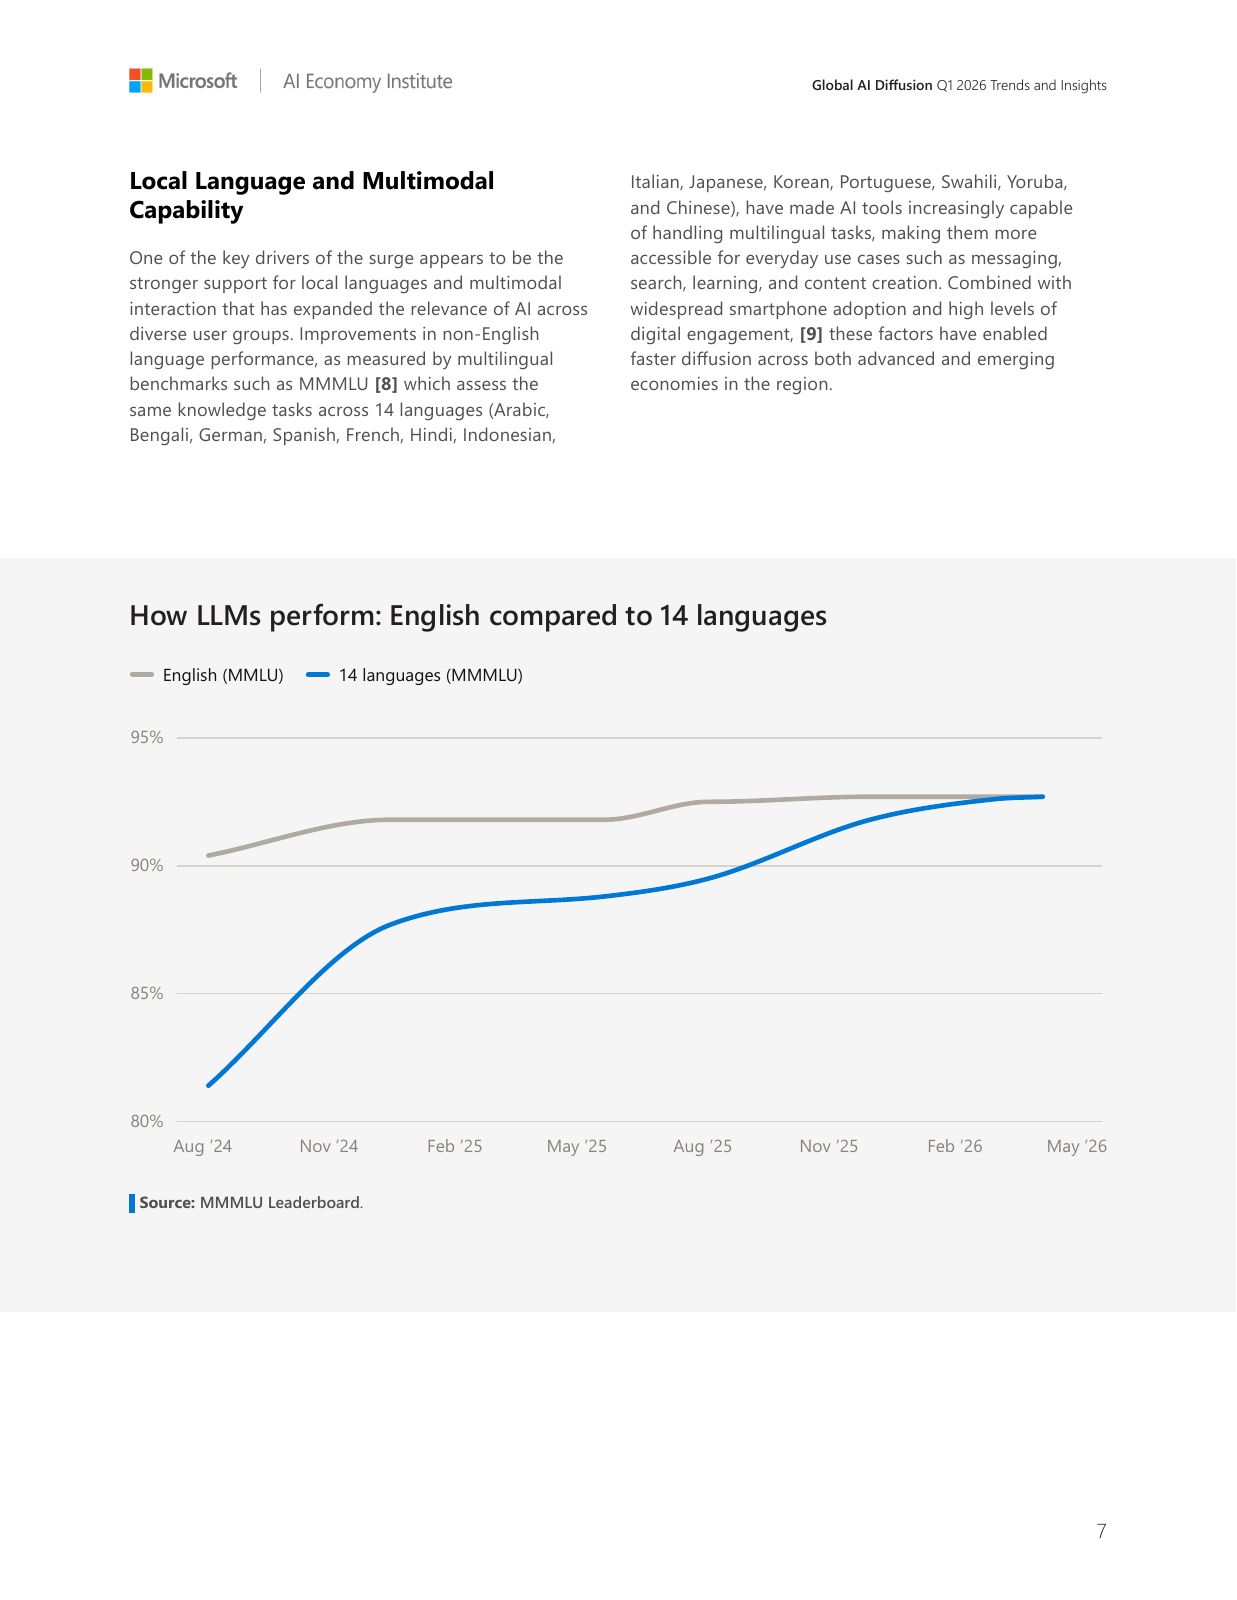
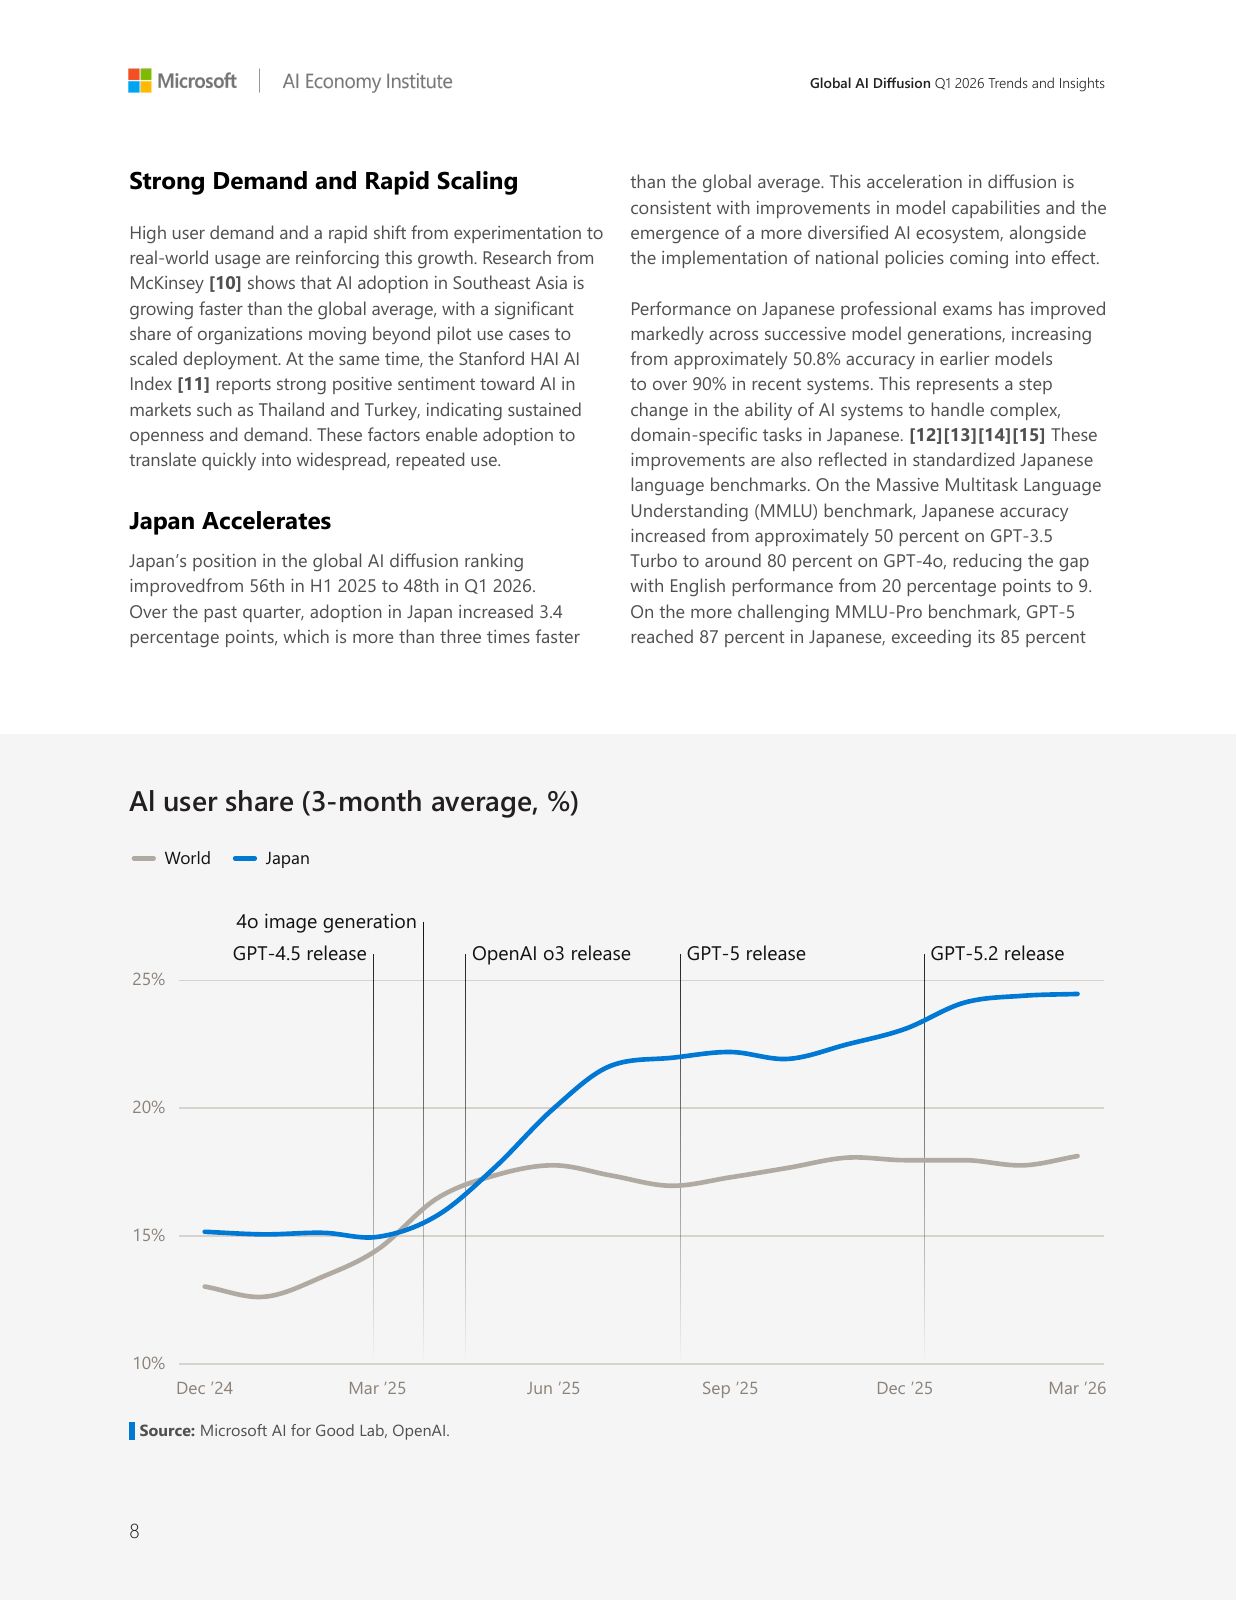
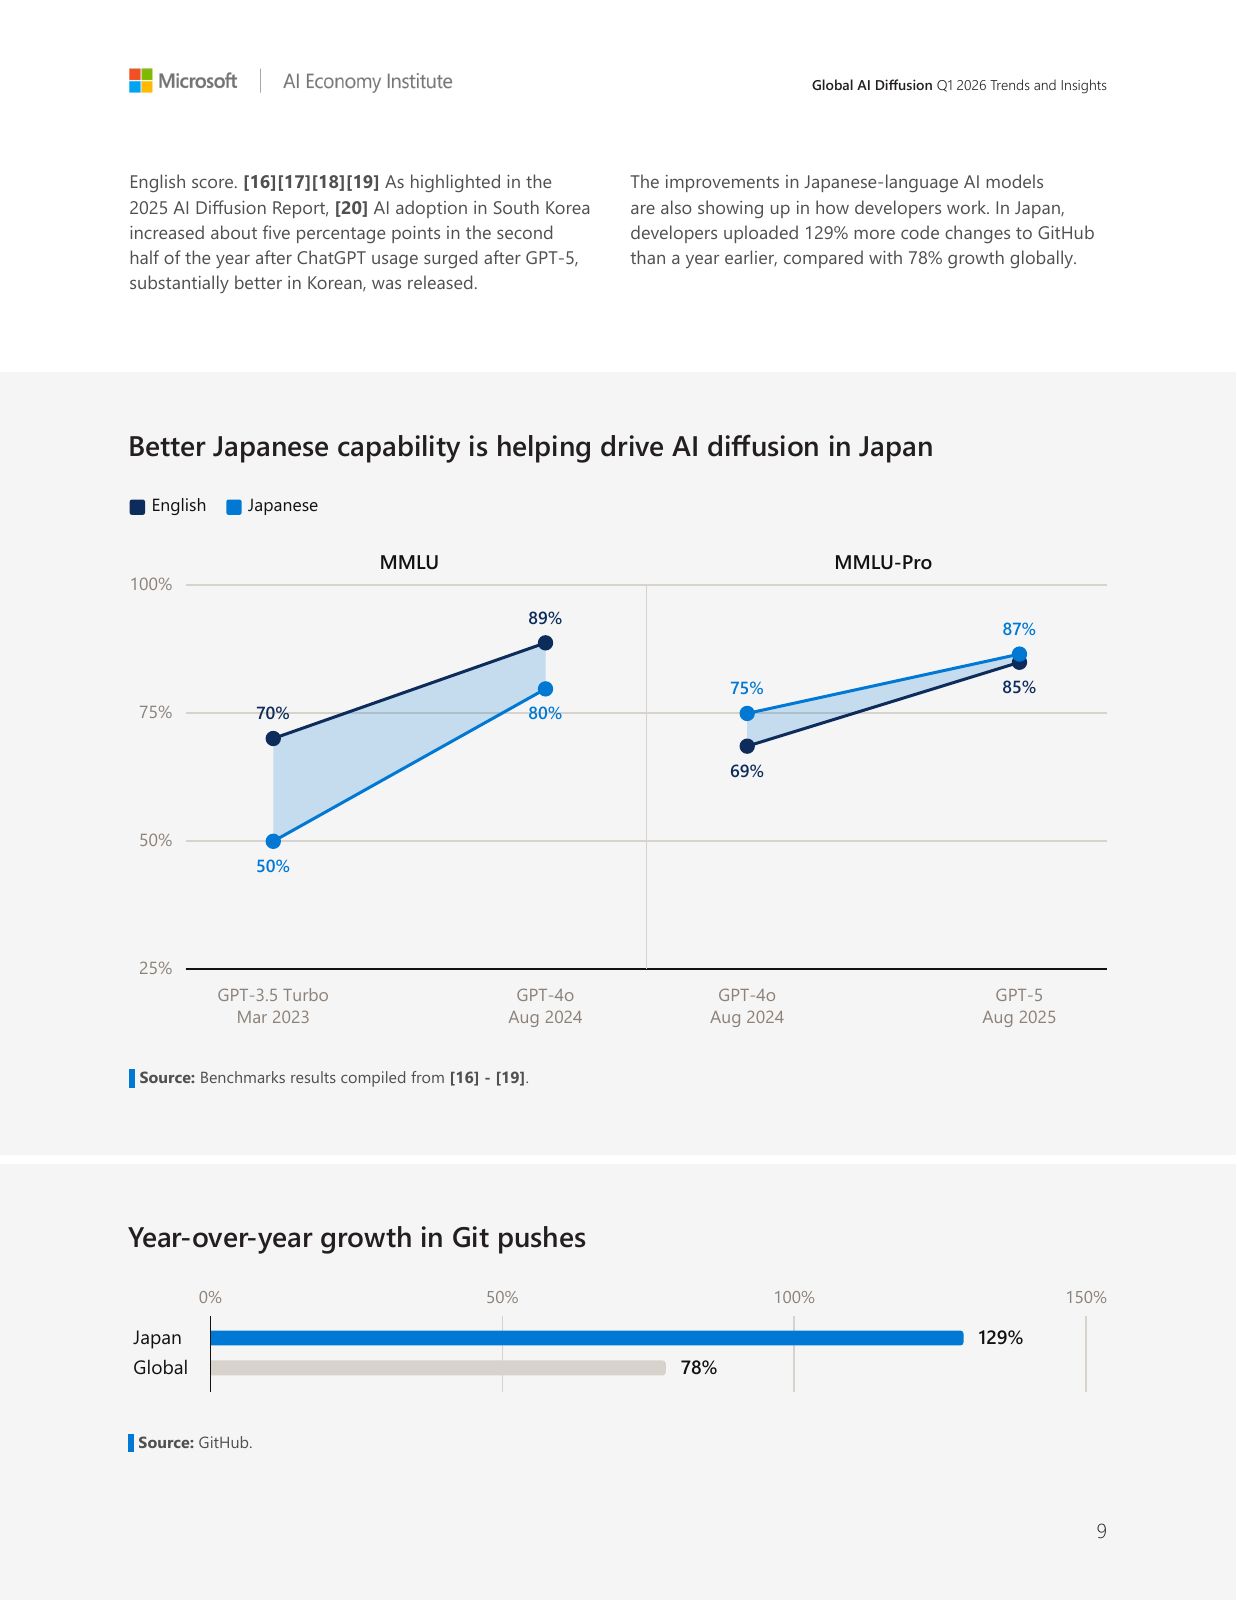
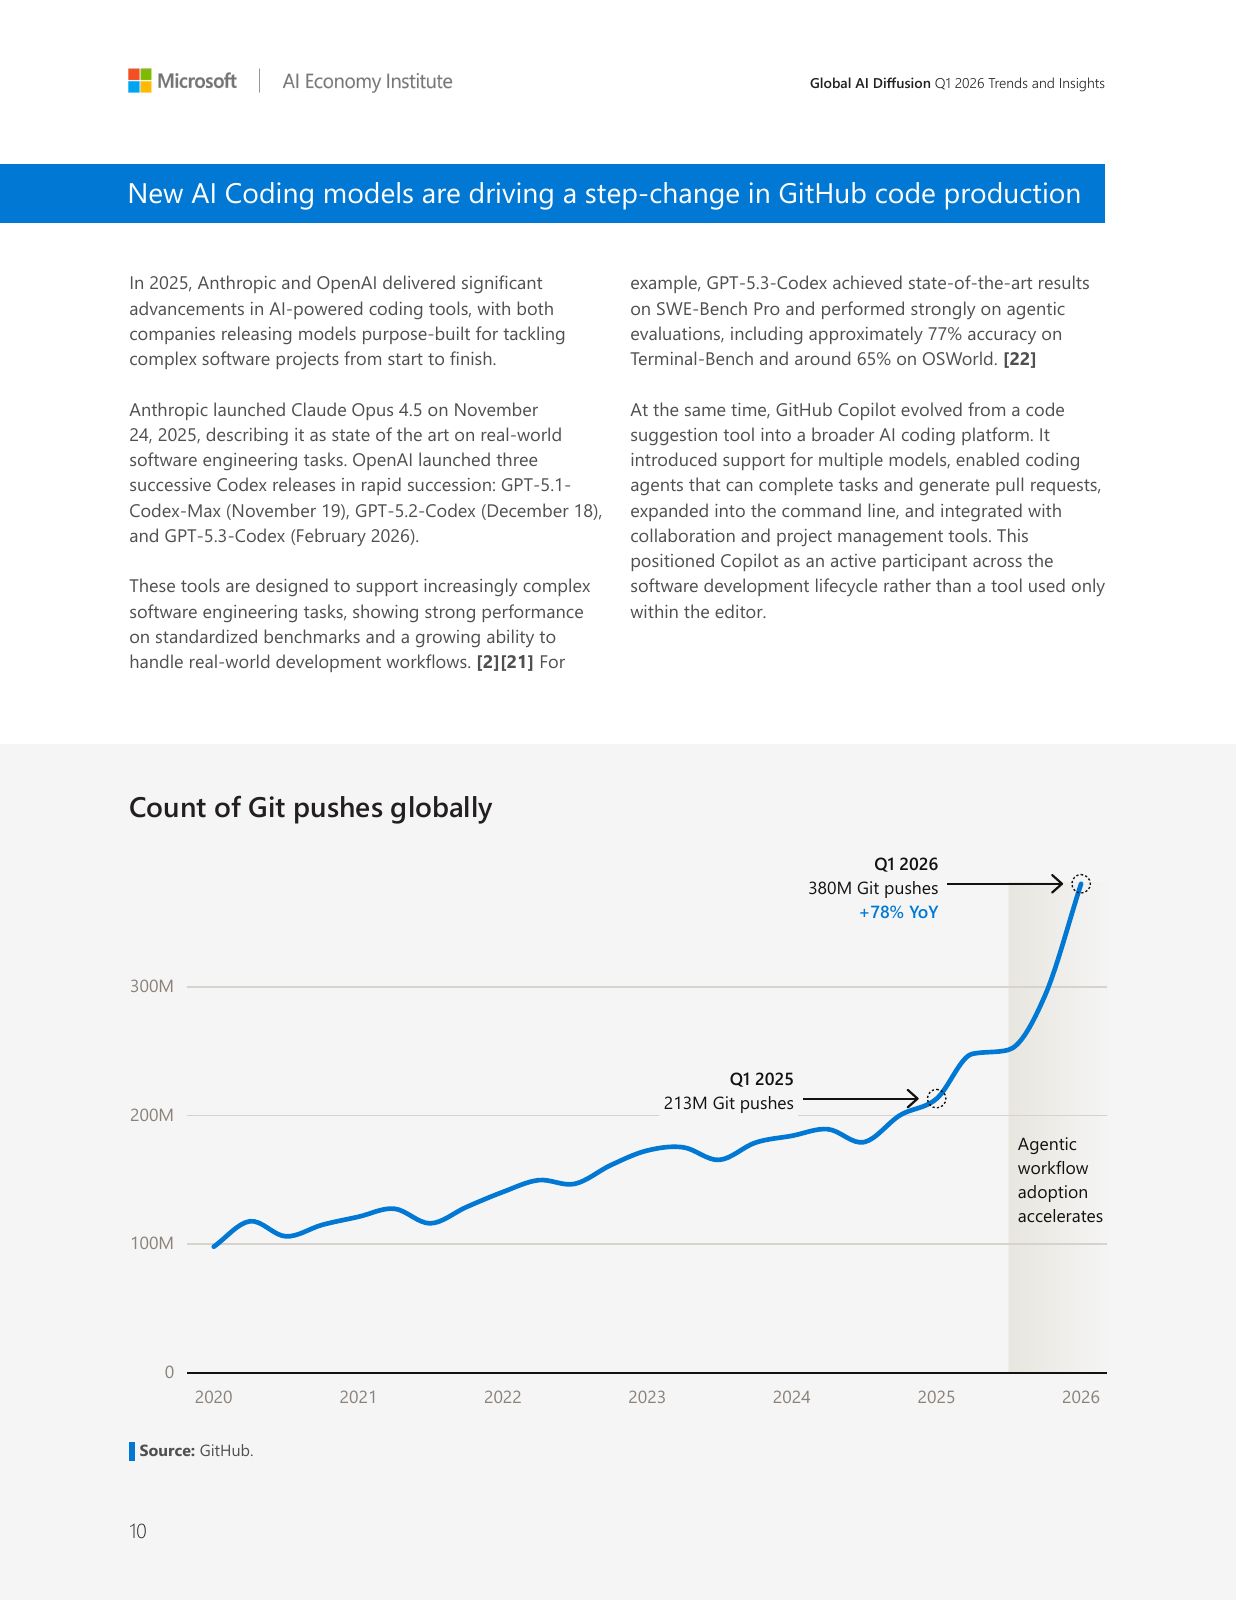
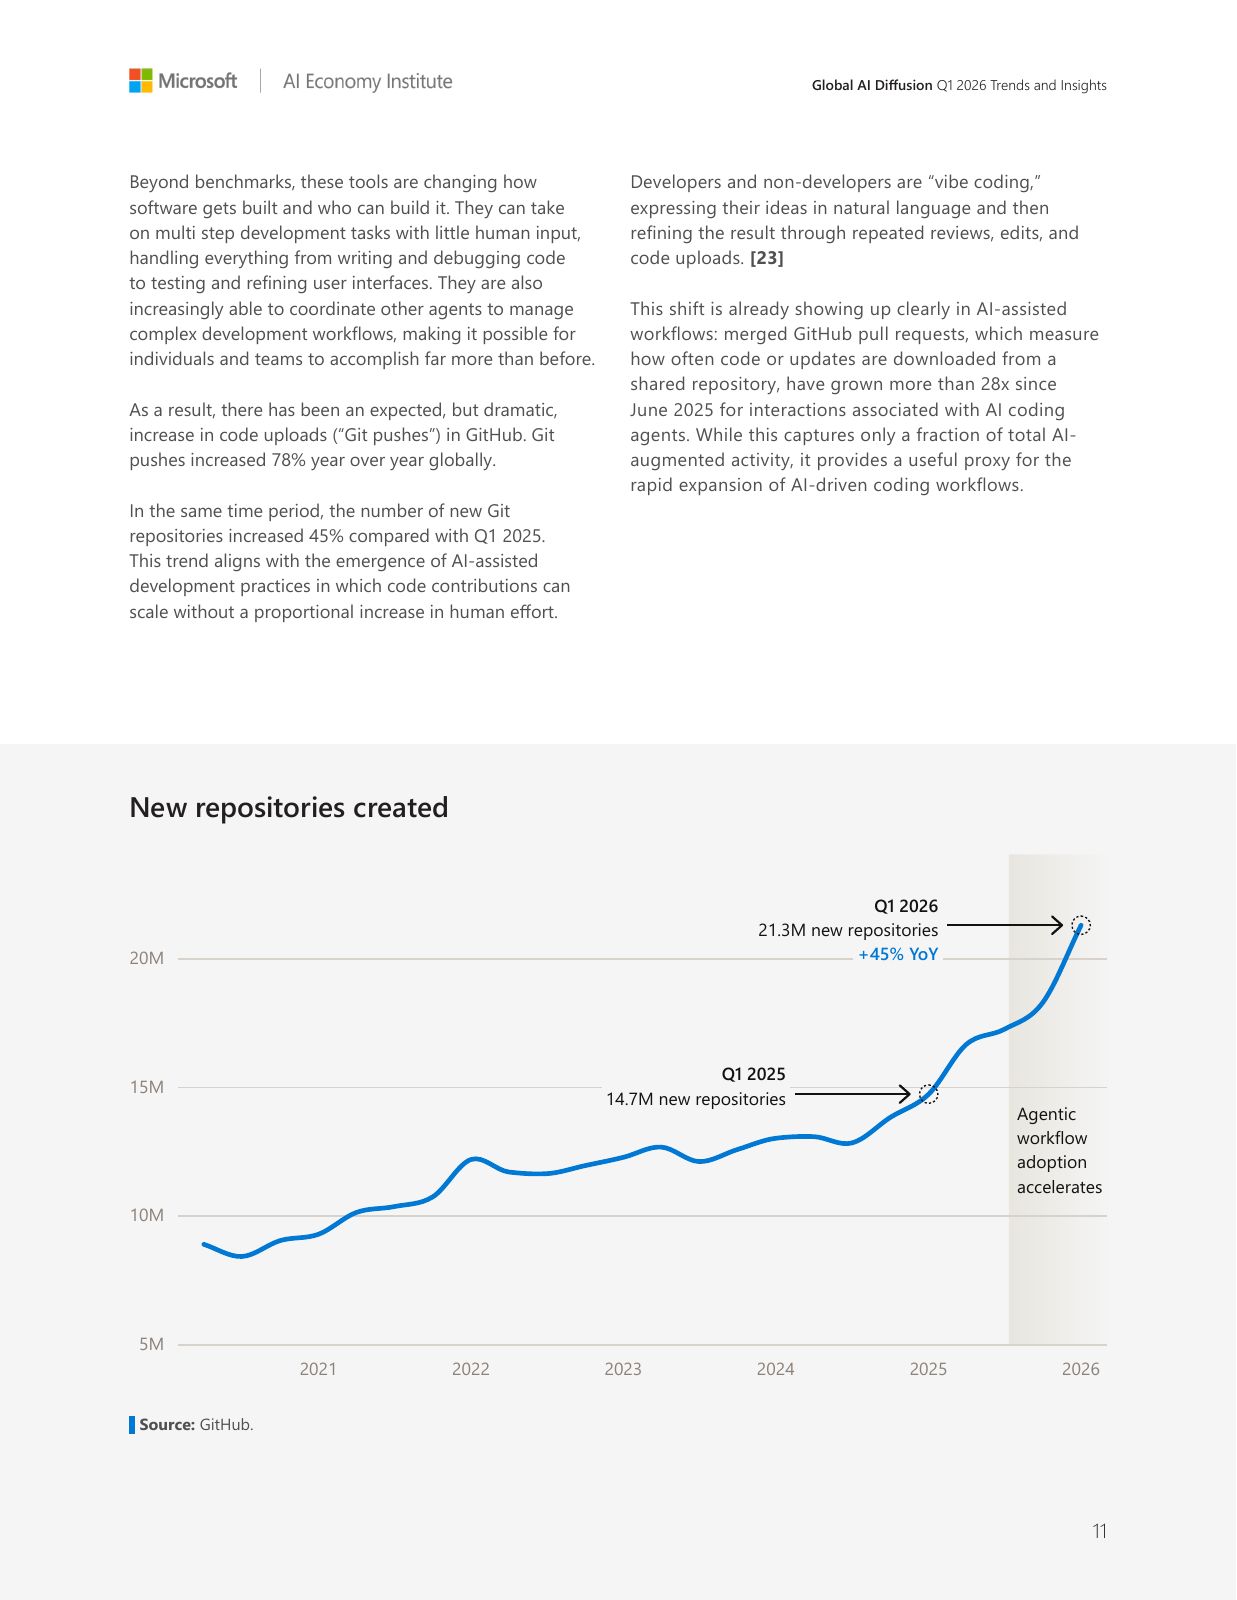
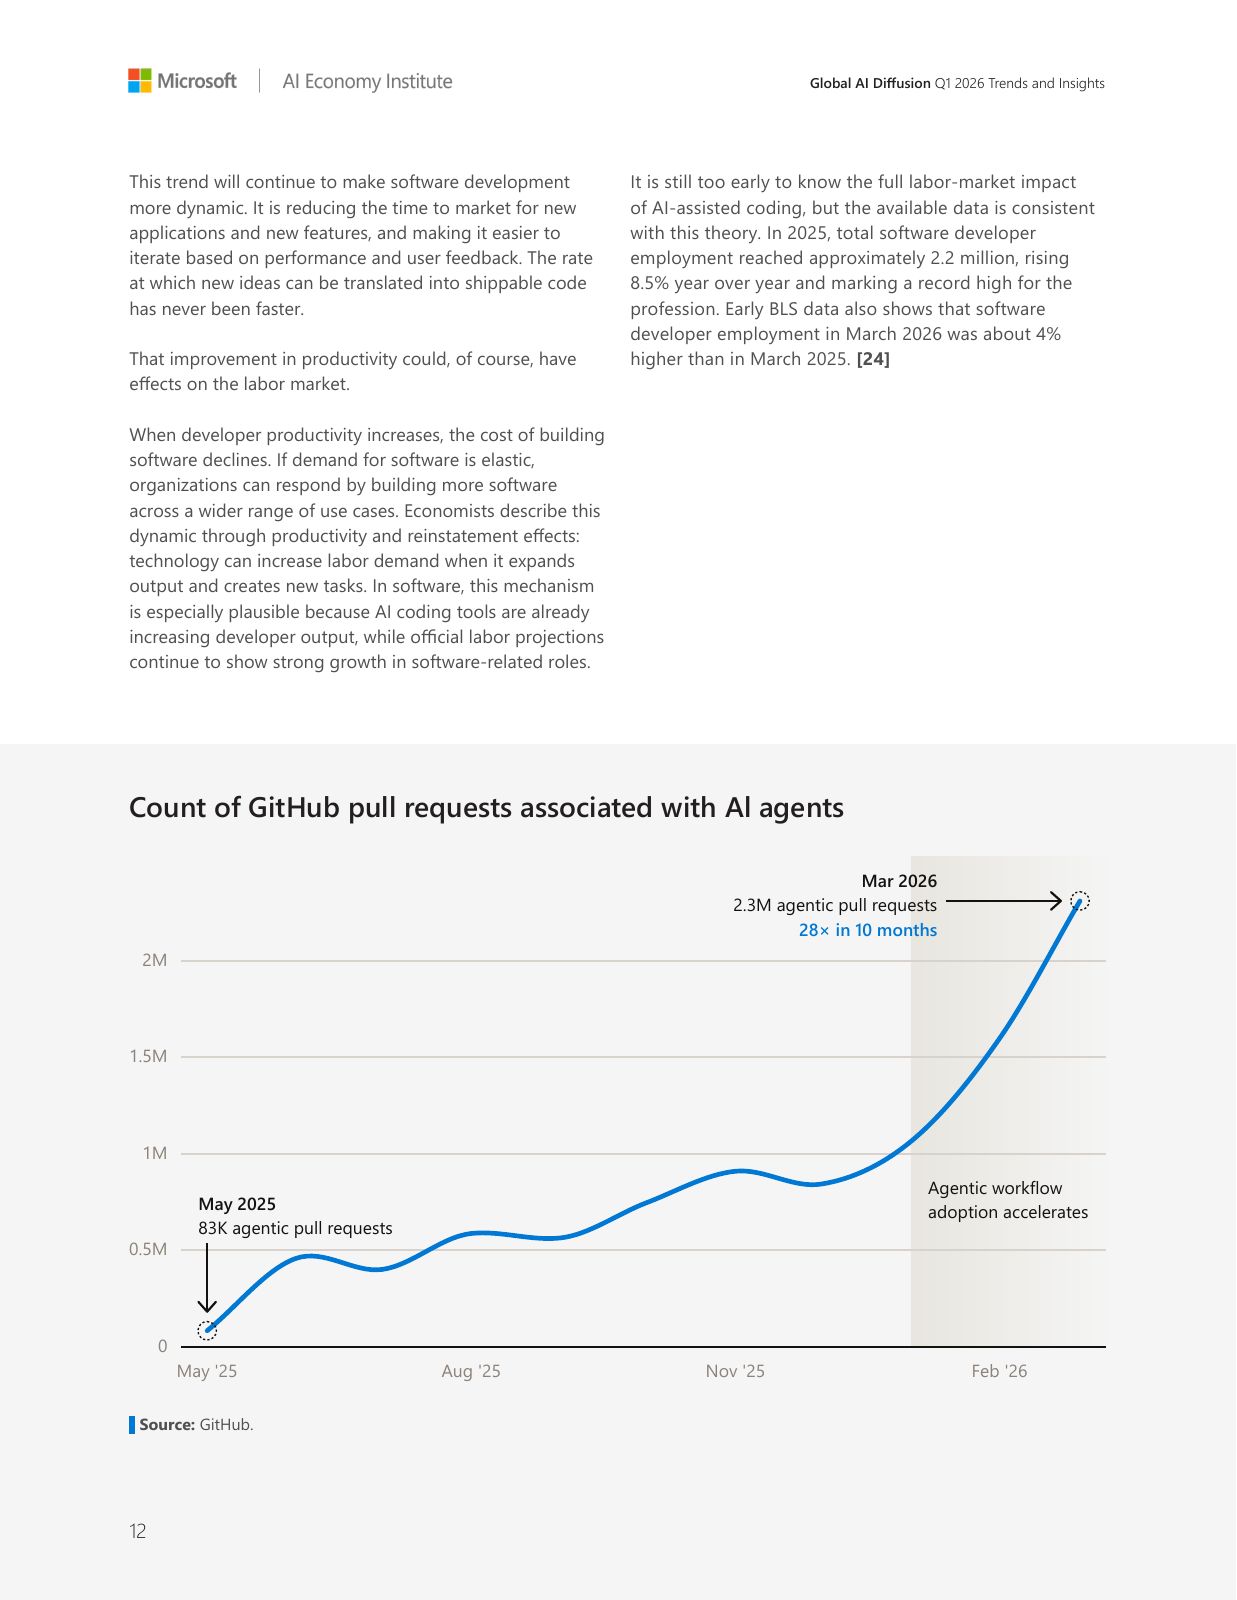

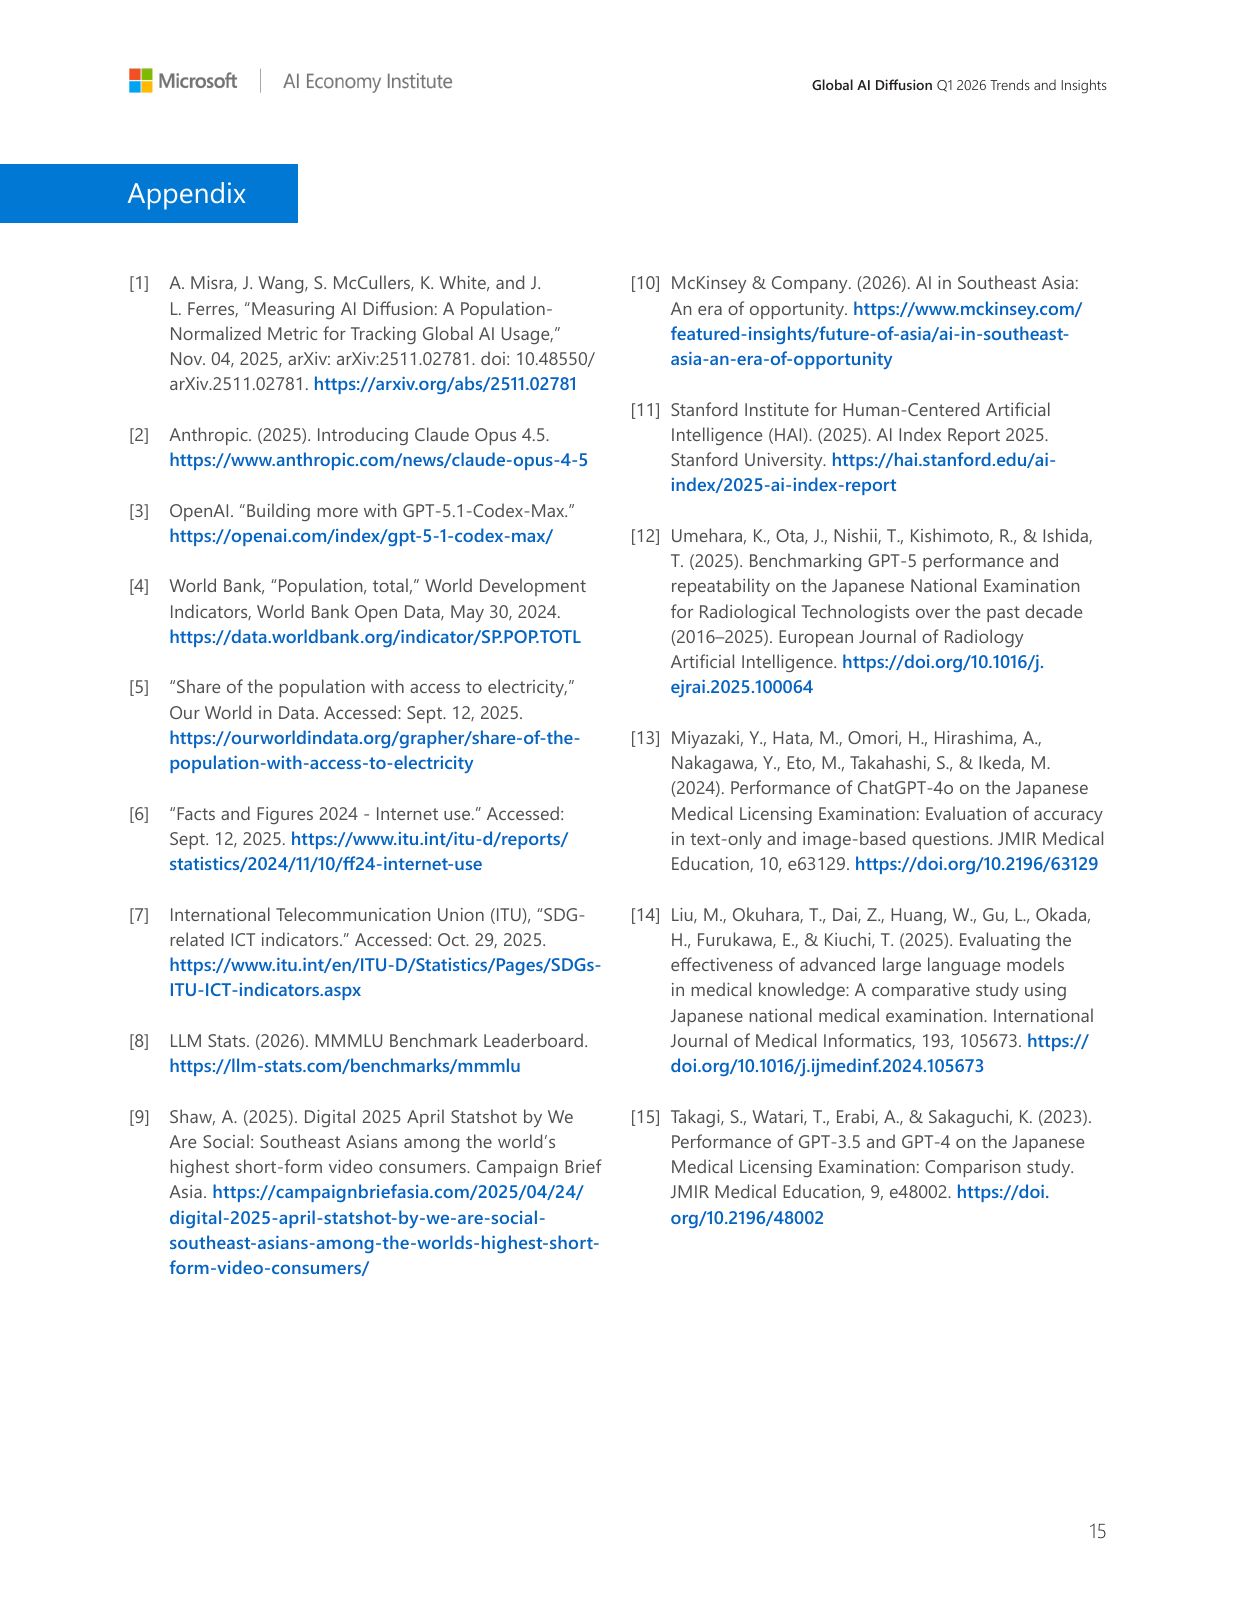
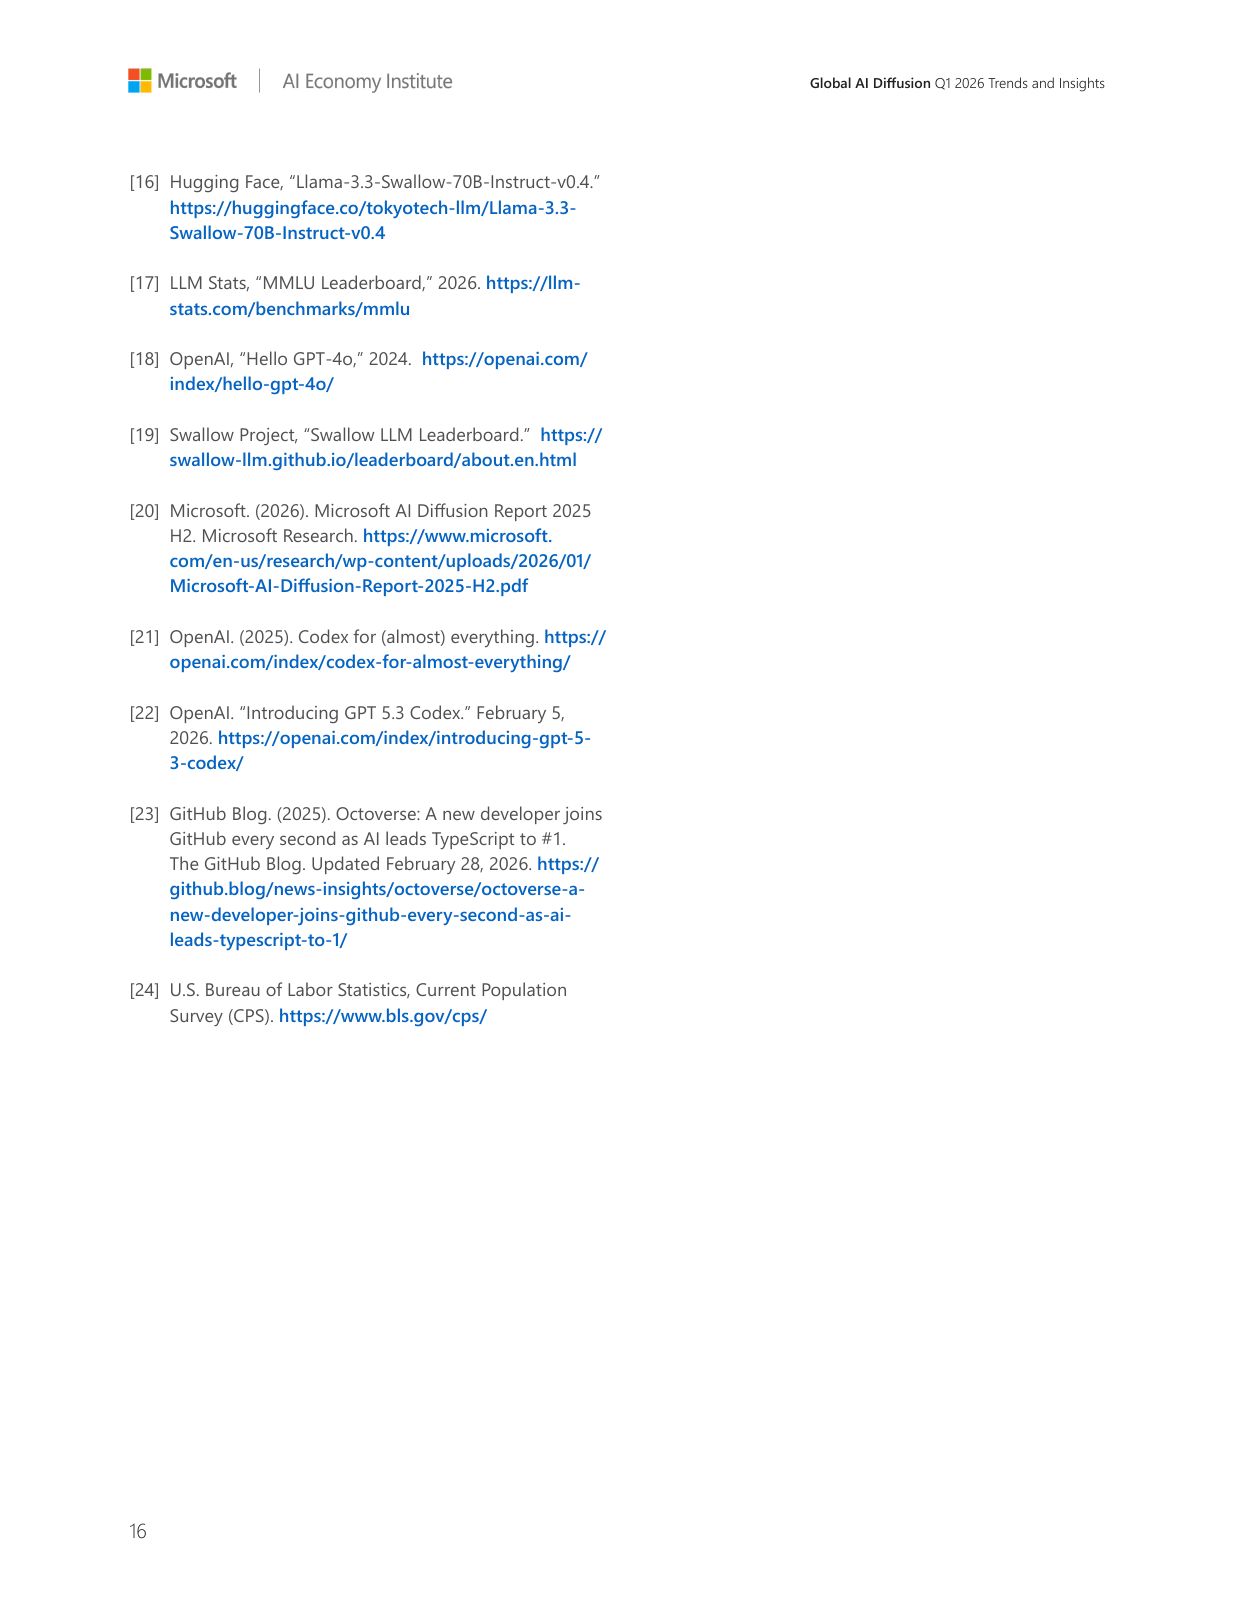
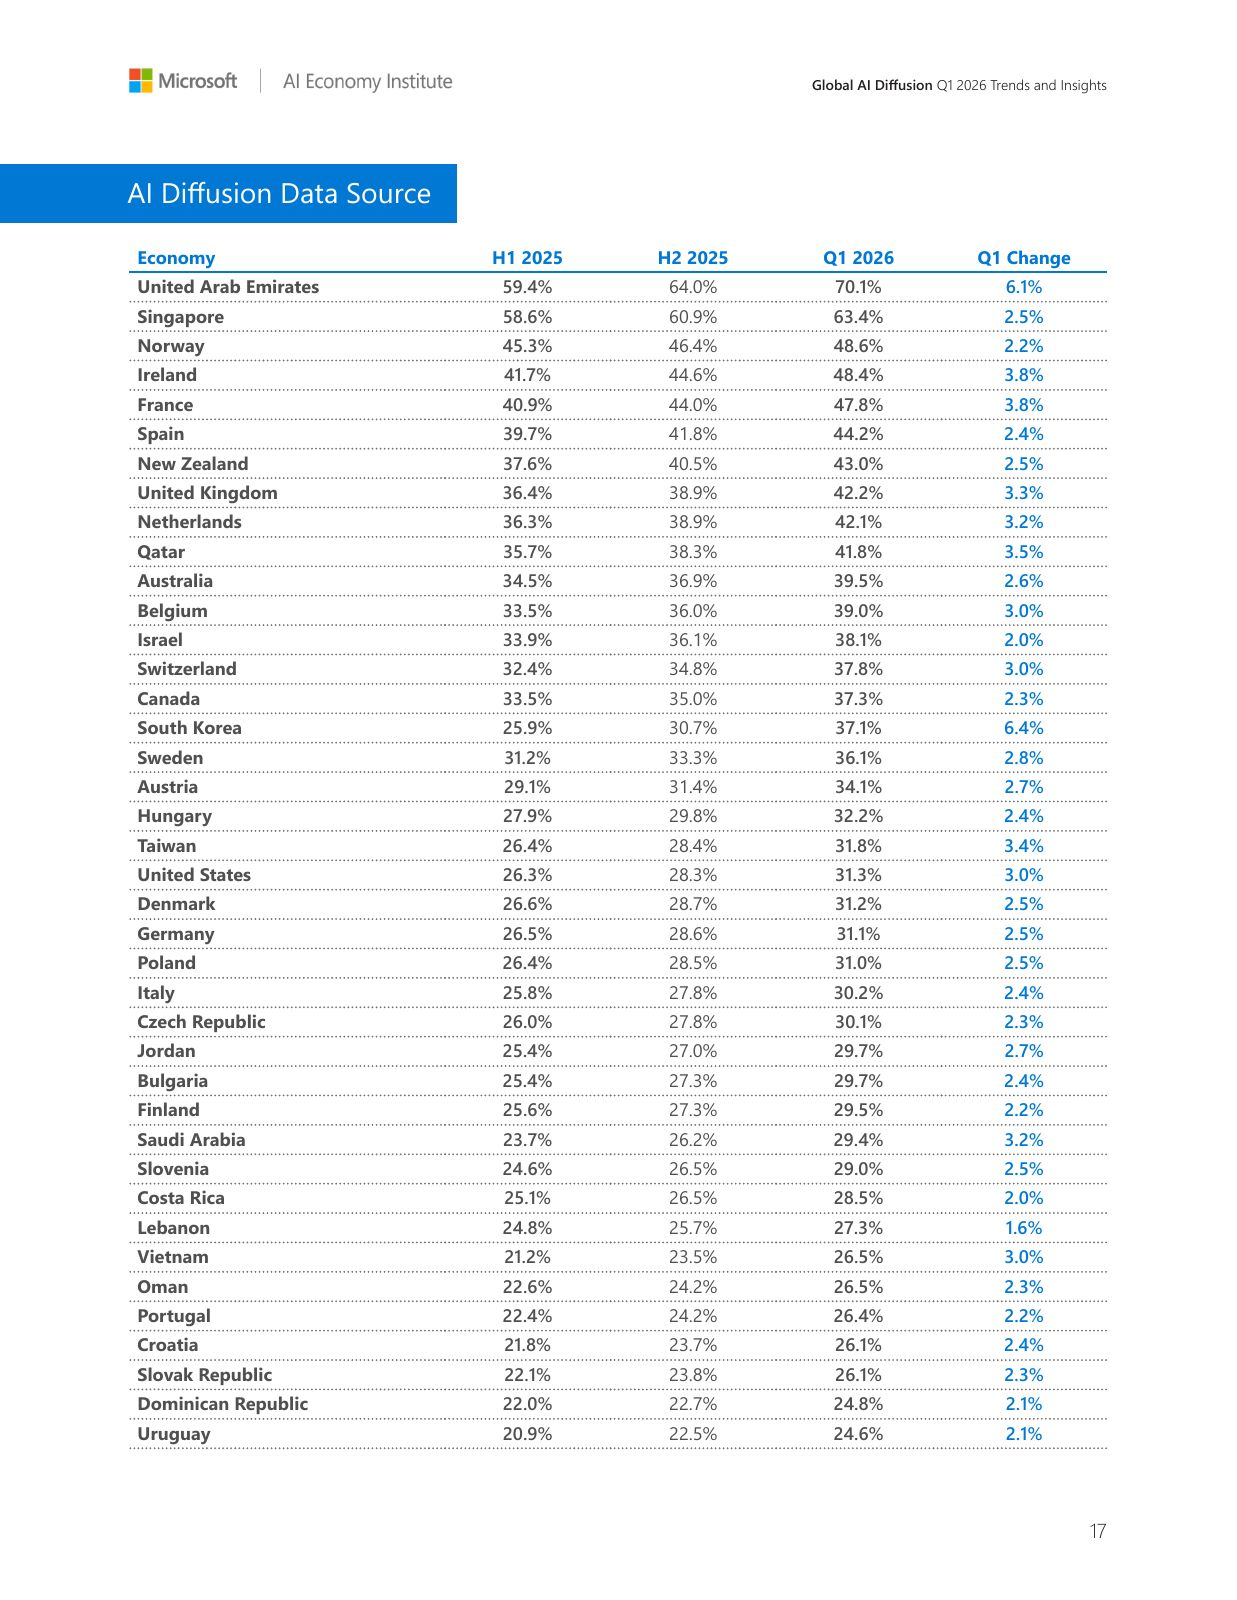
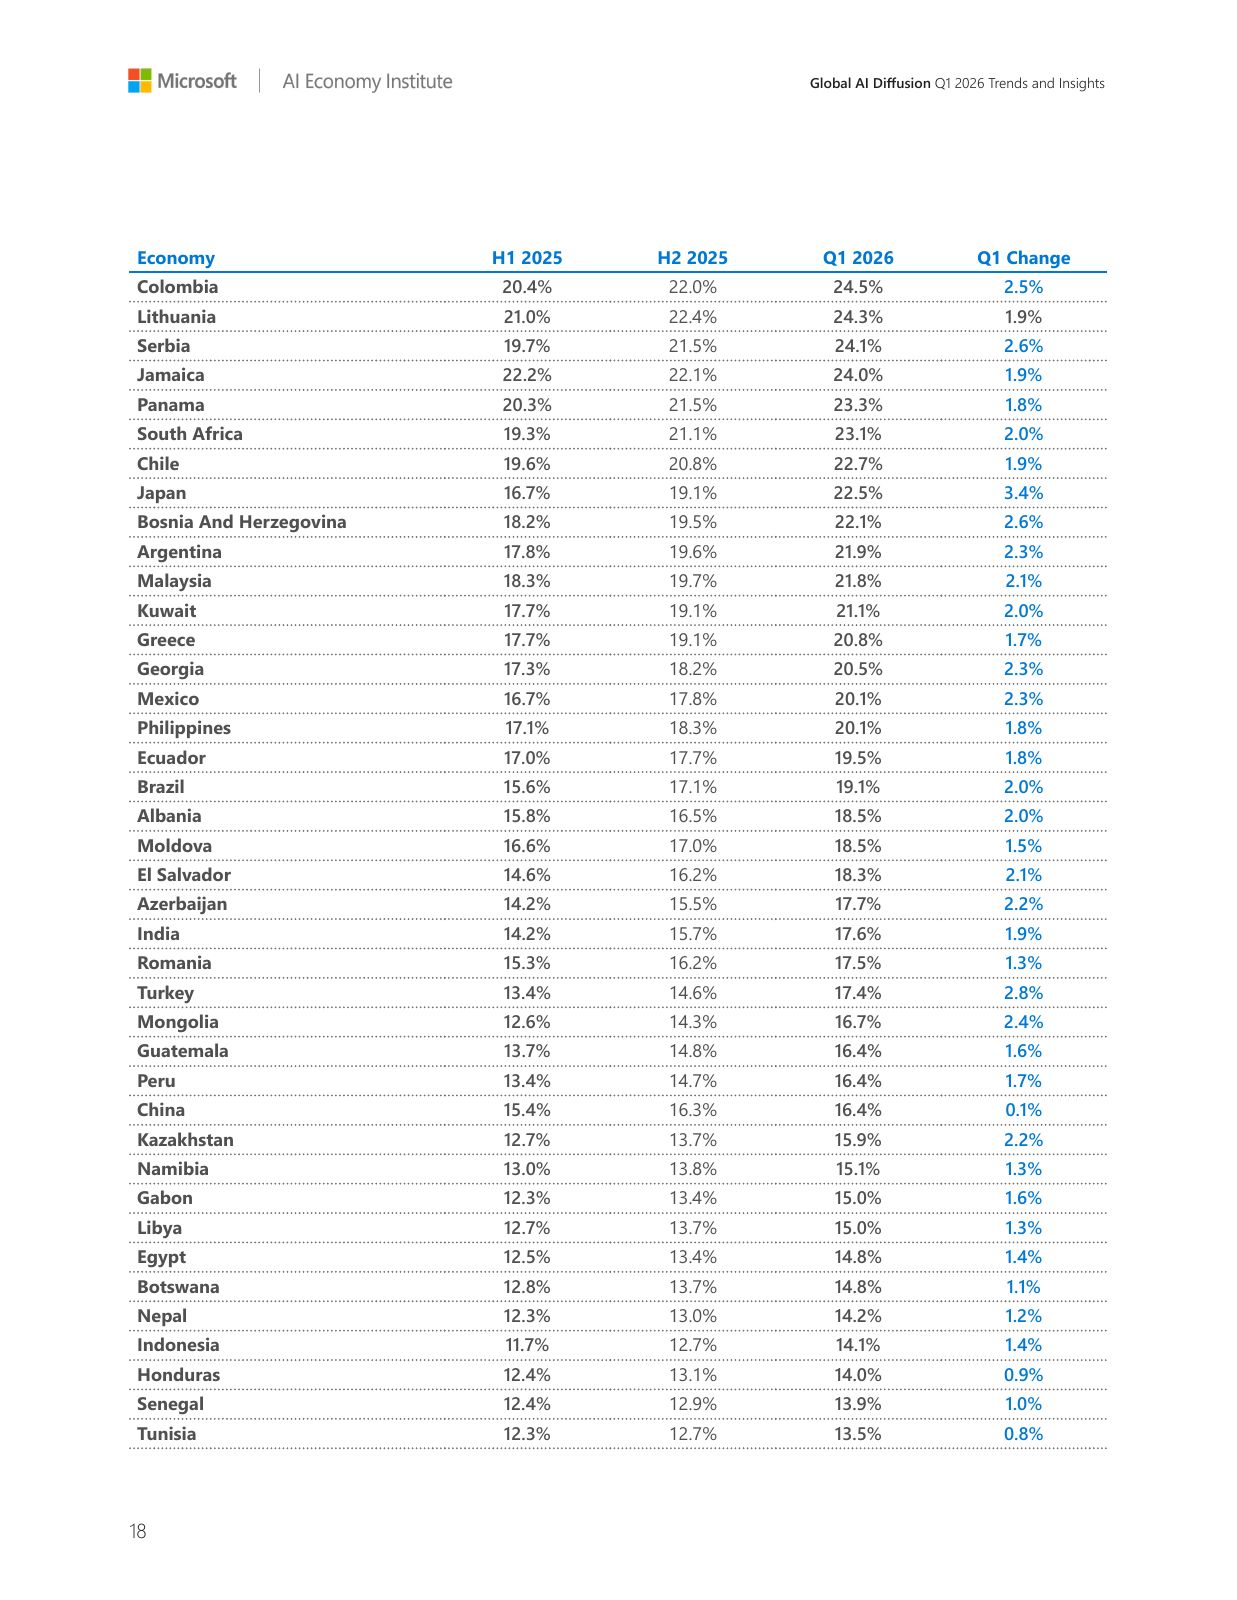
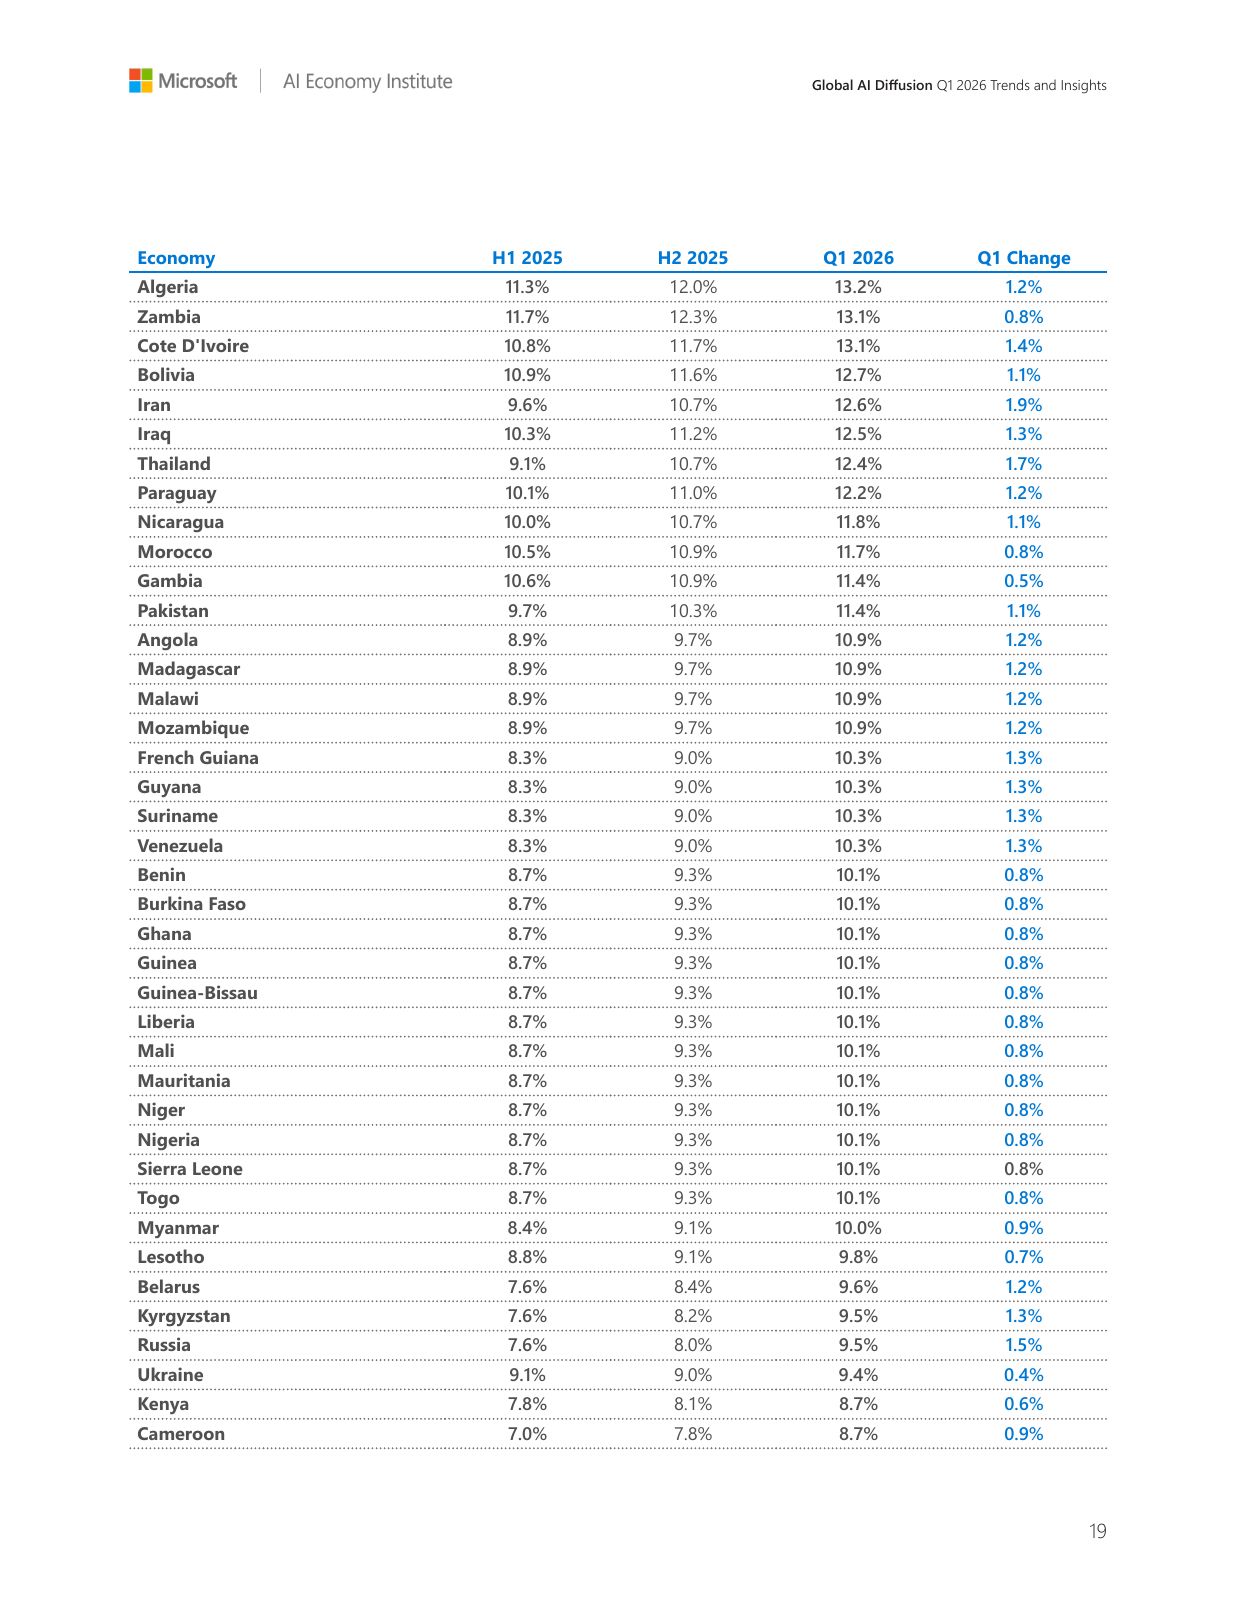
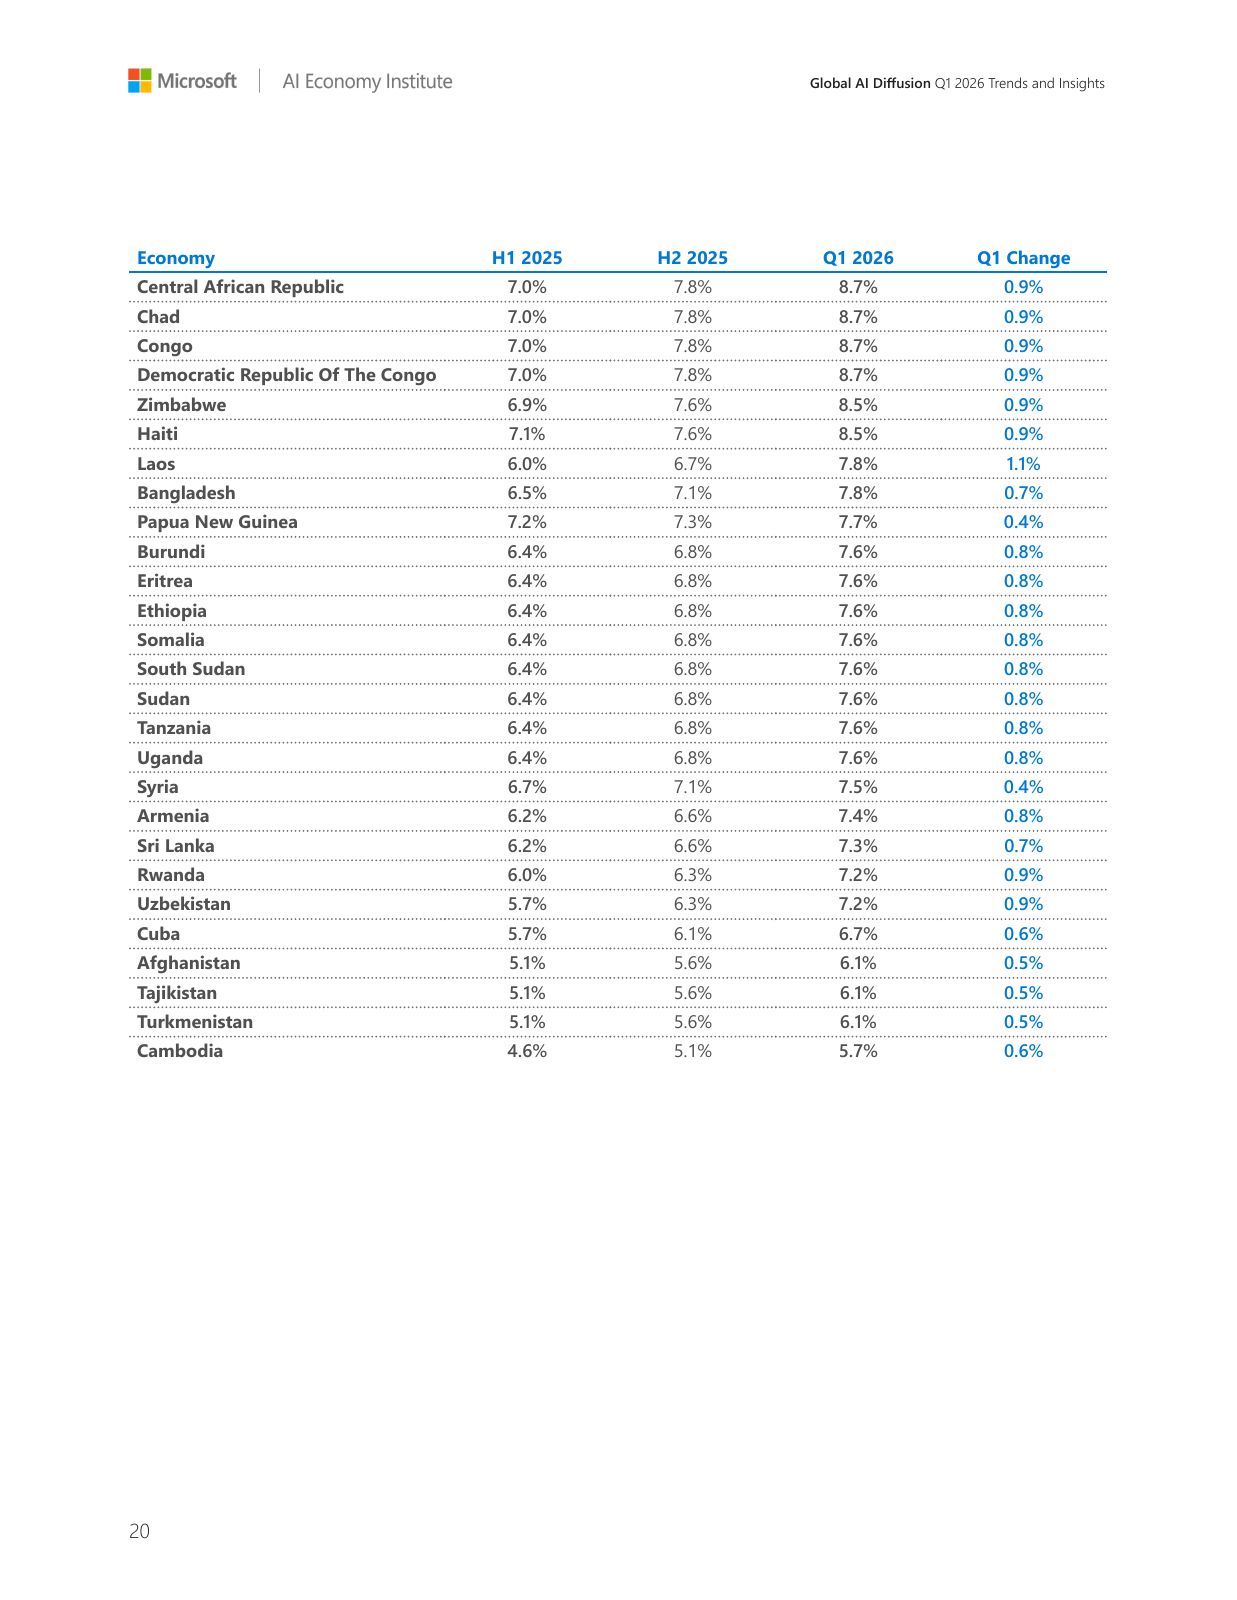

Global · Q2 2026
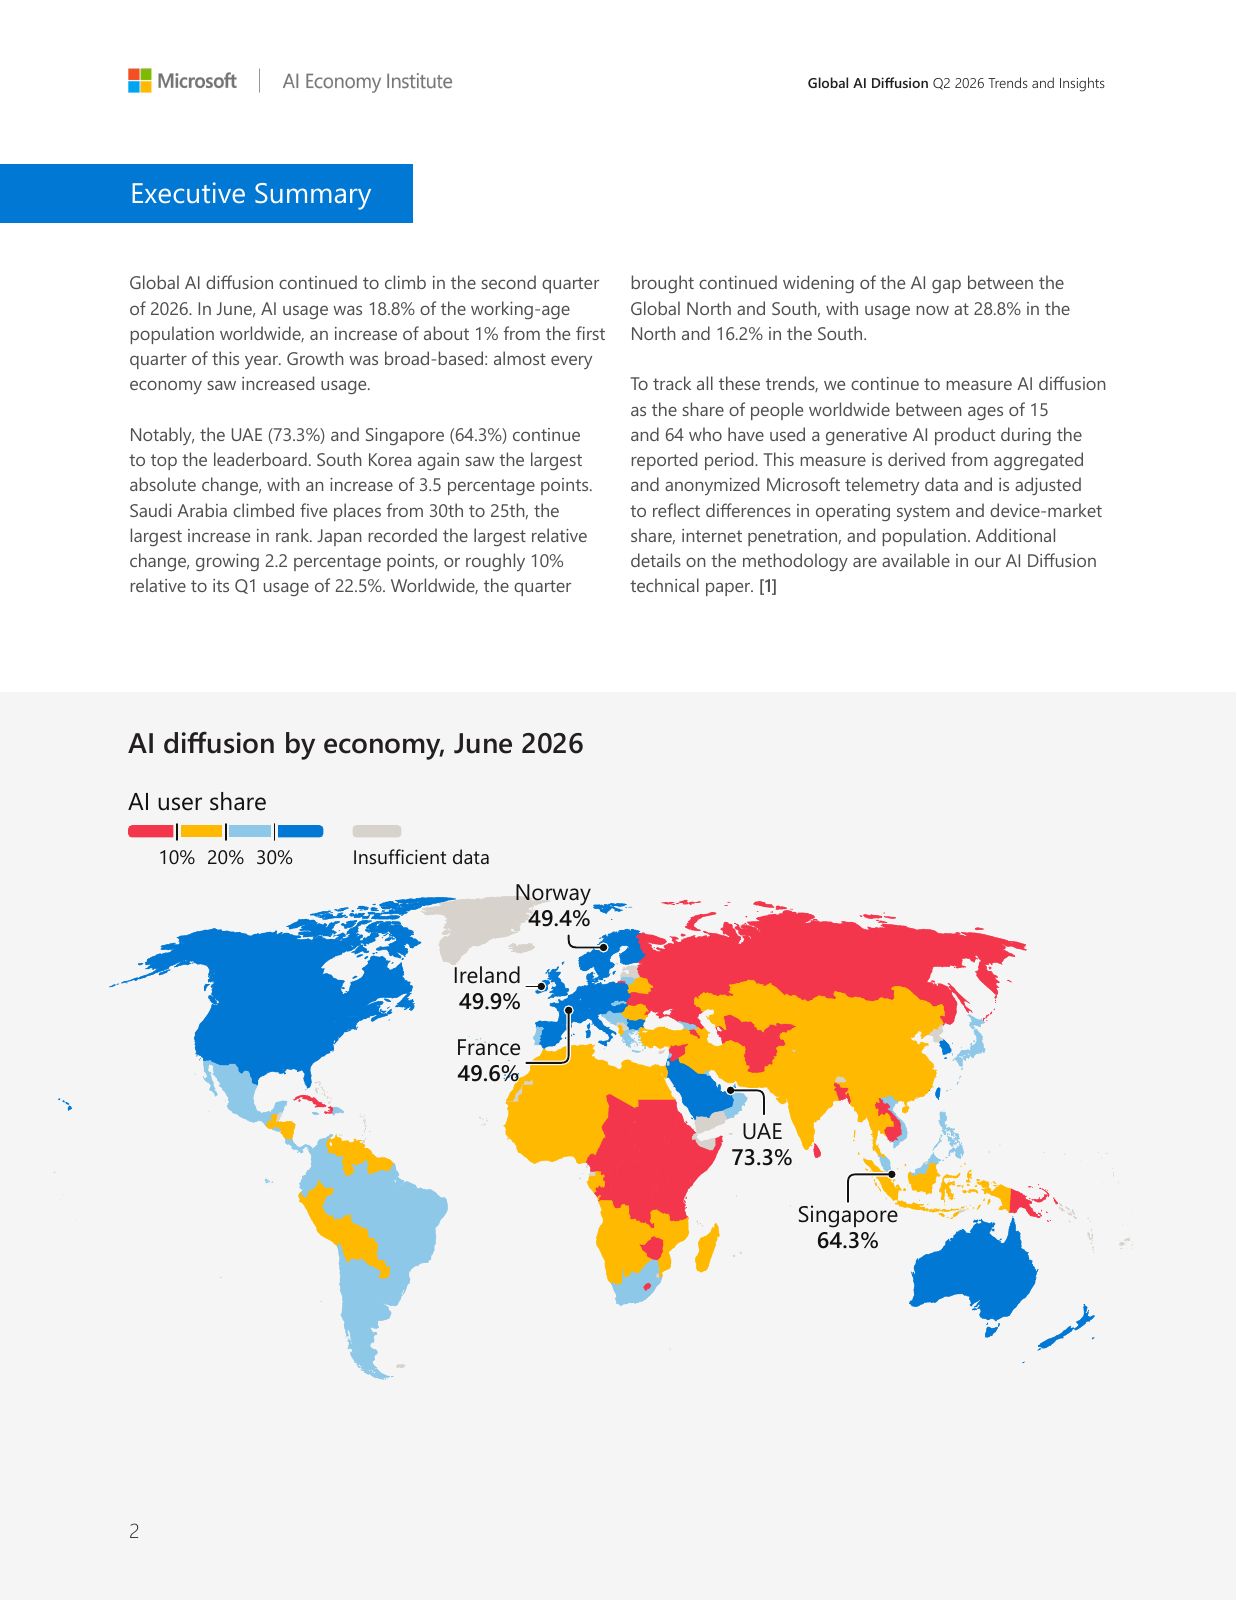
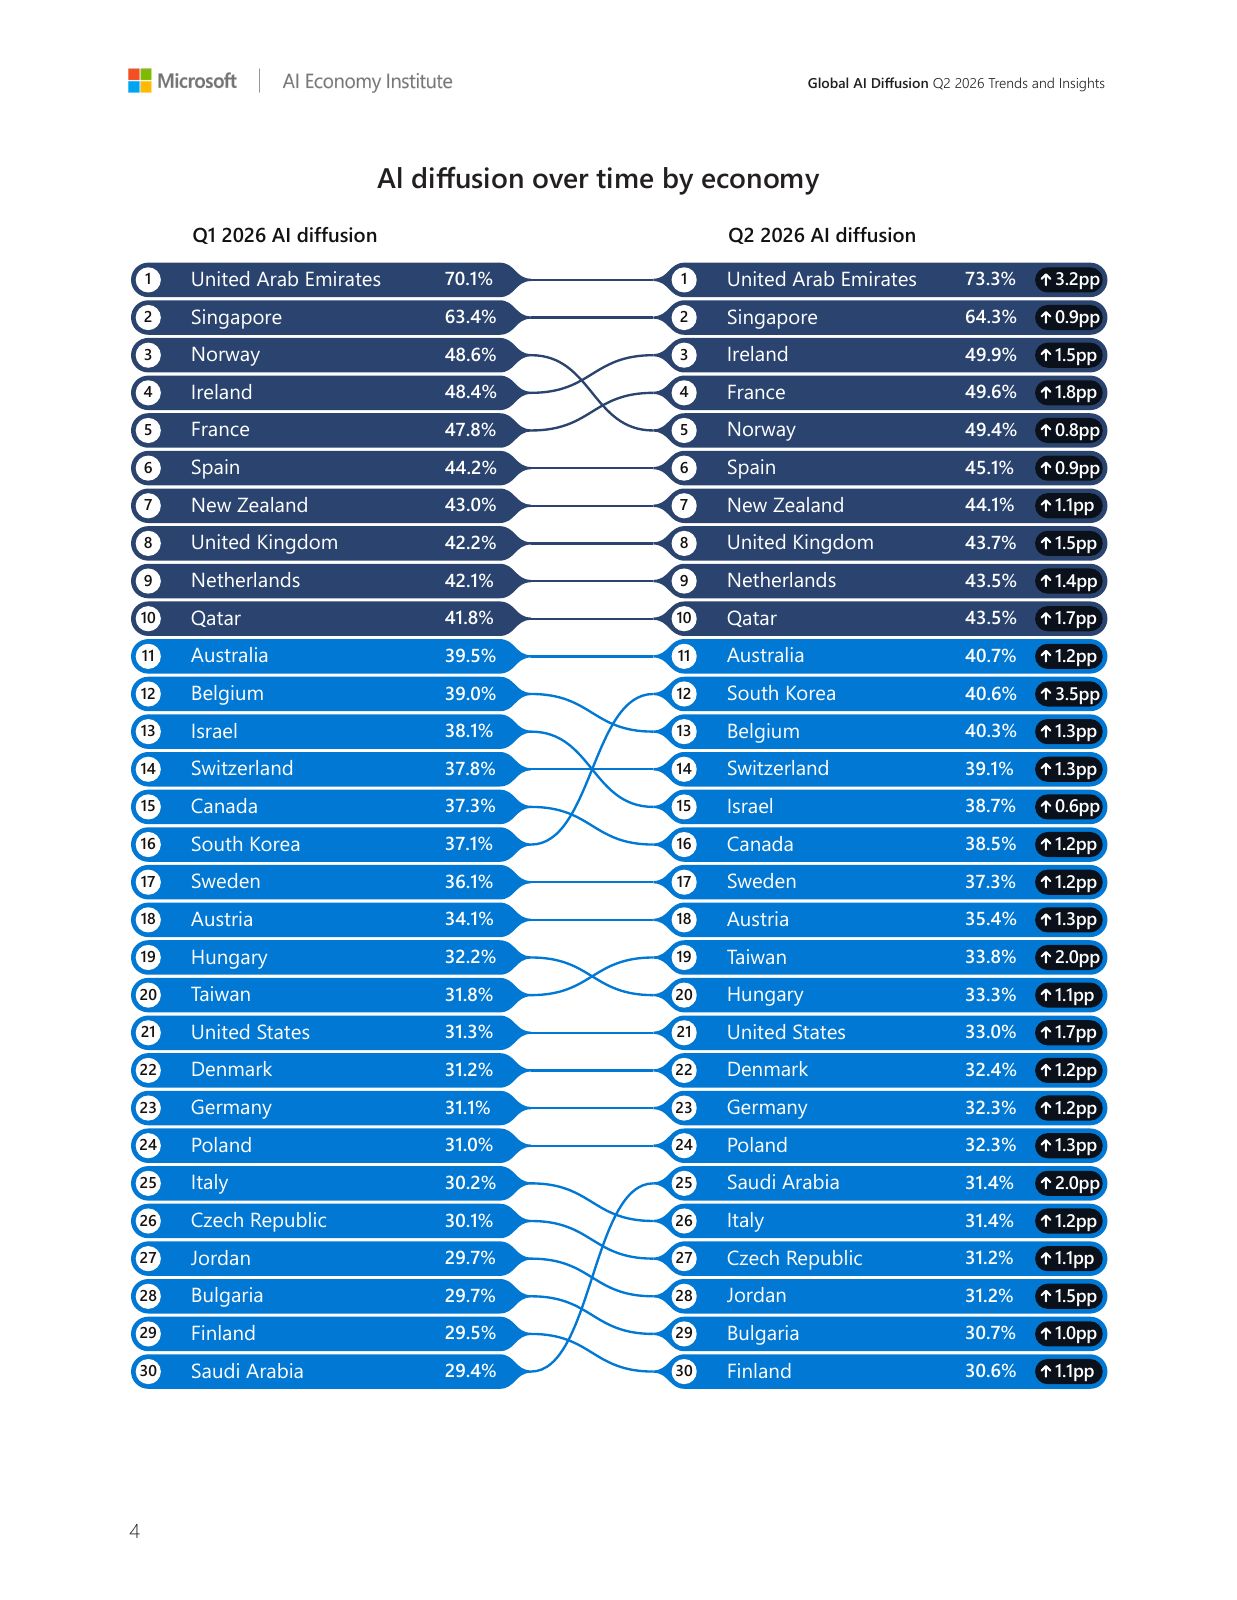
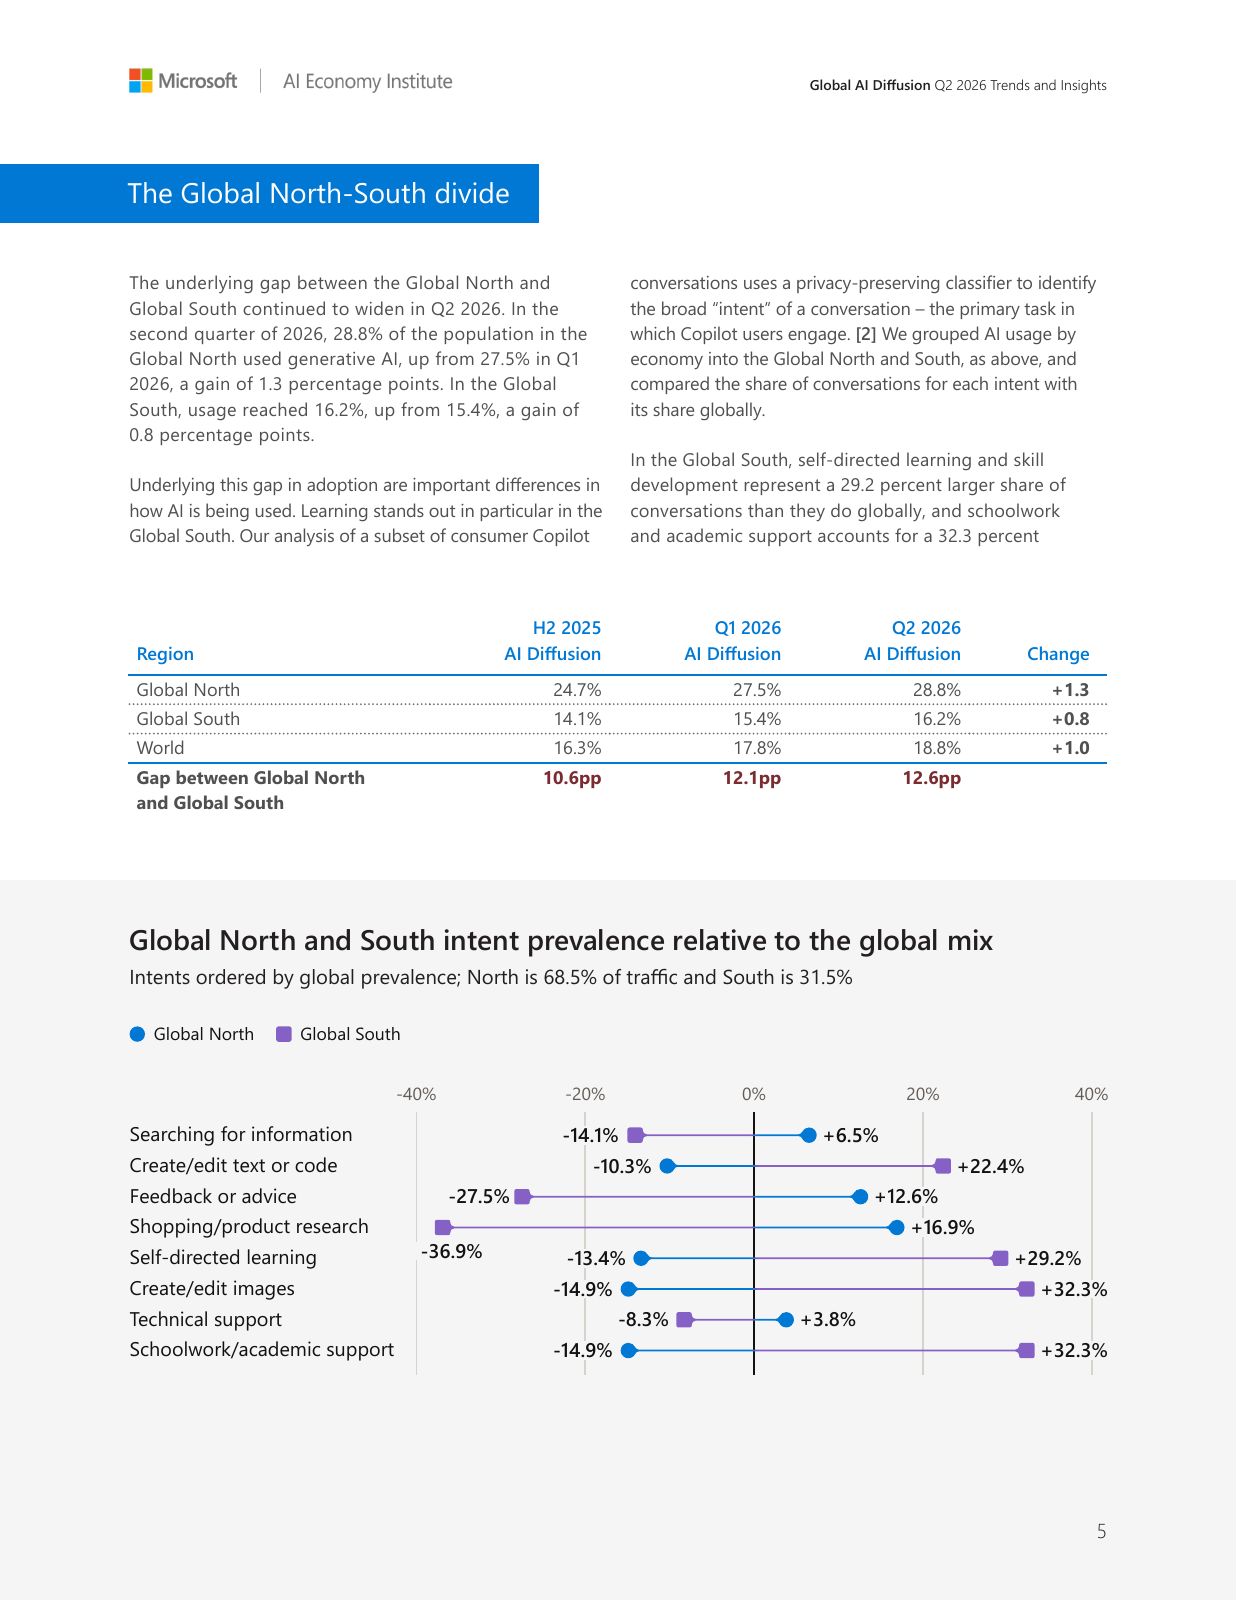
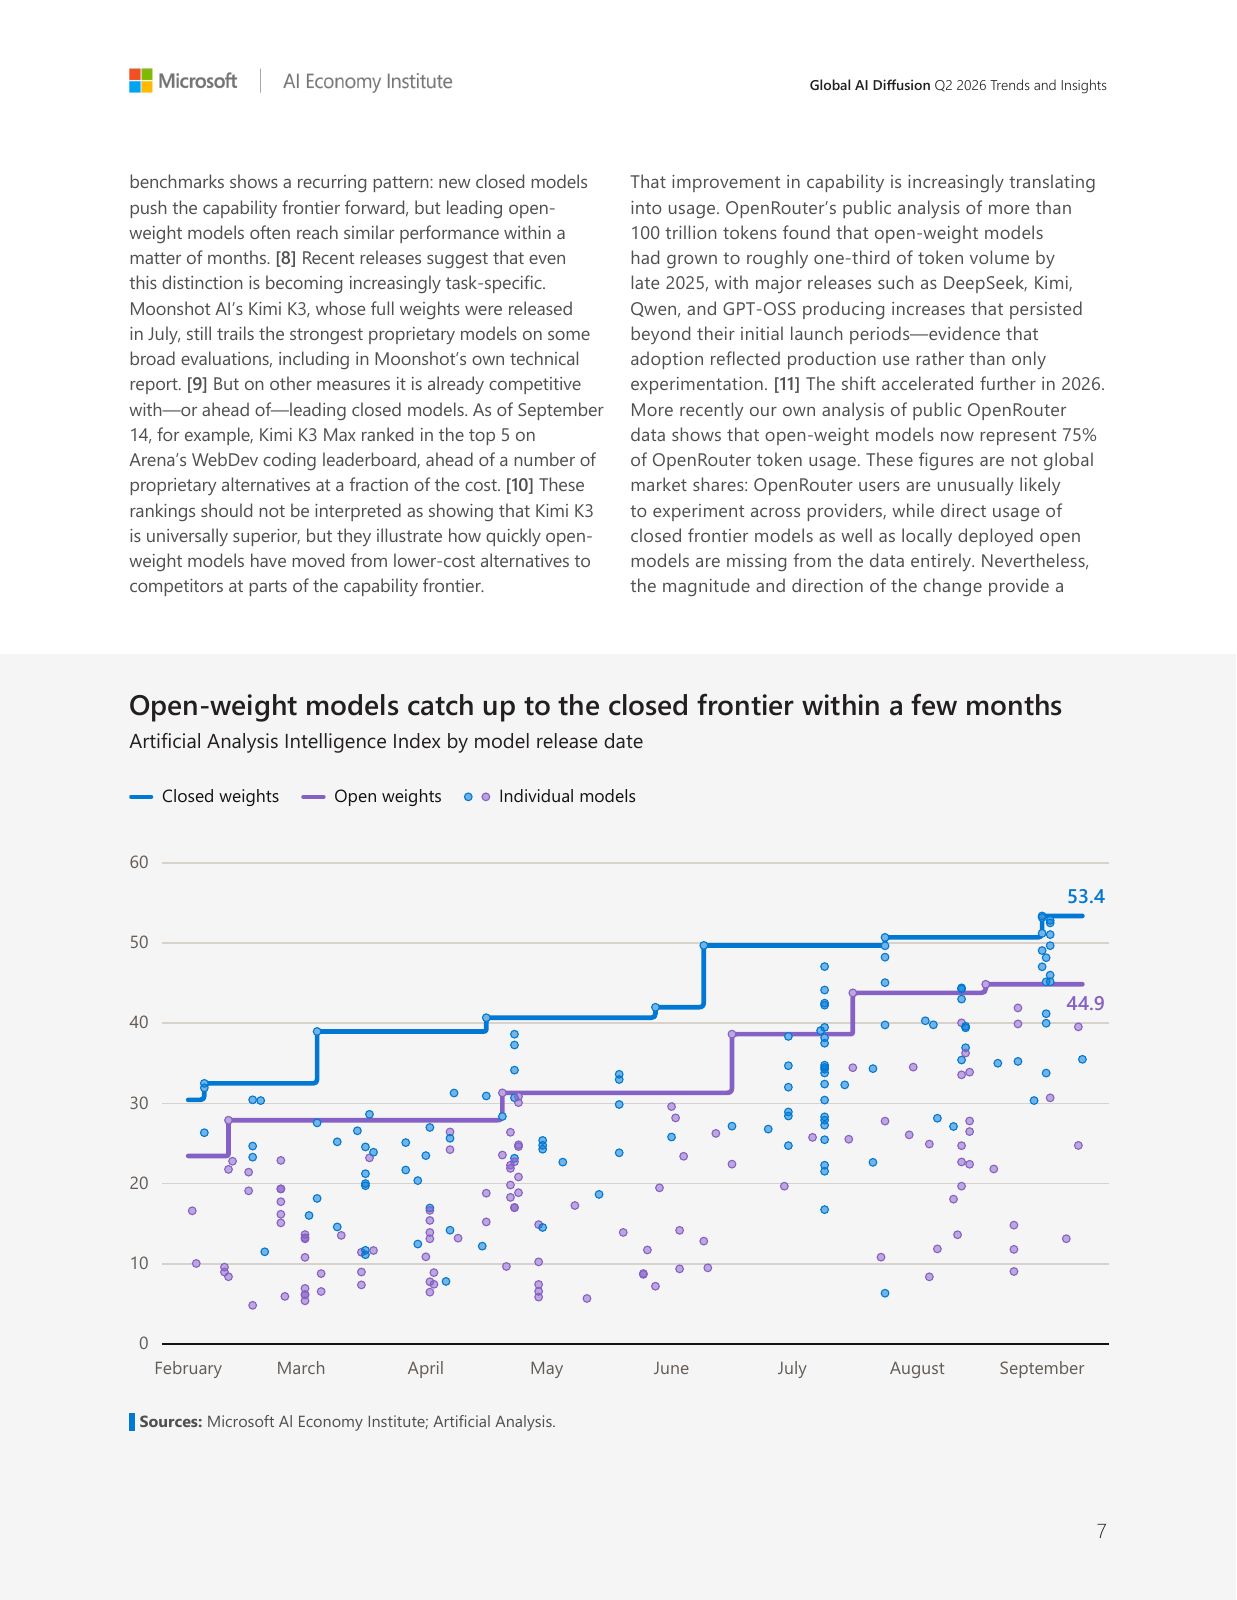
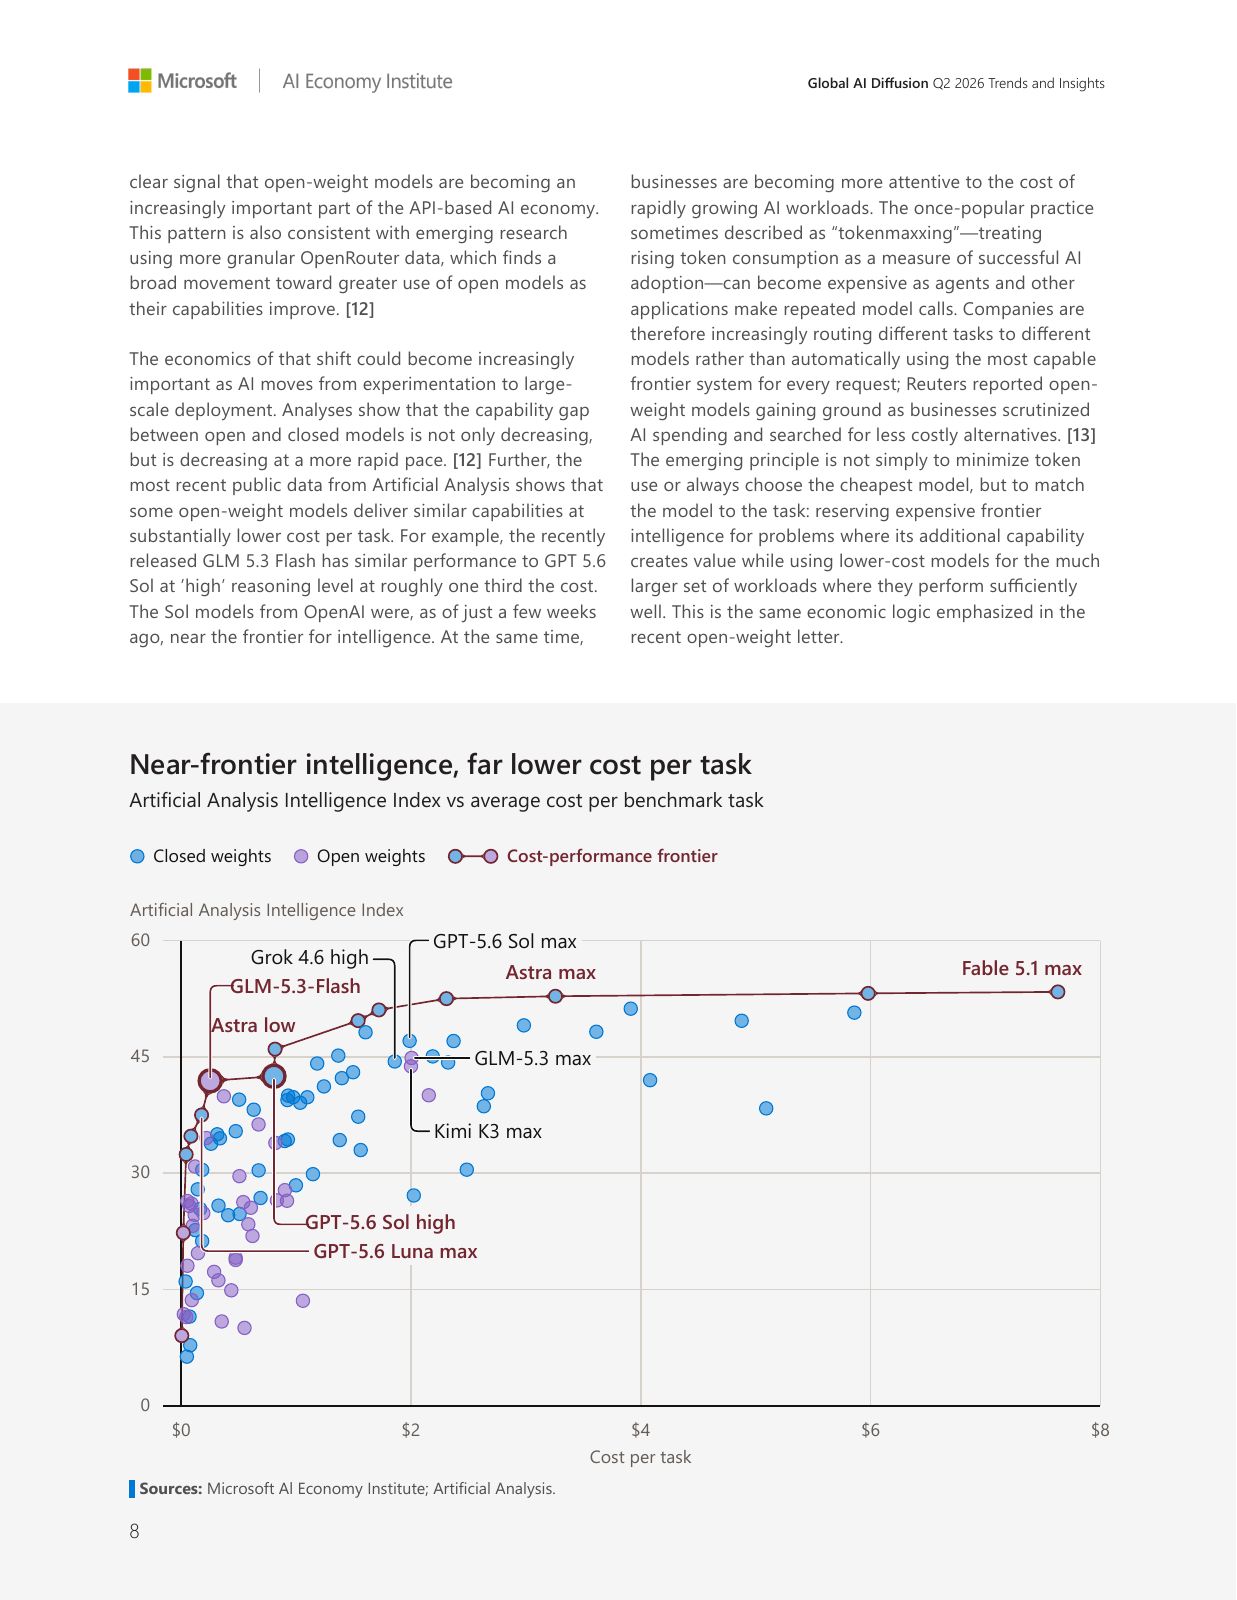
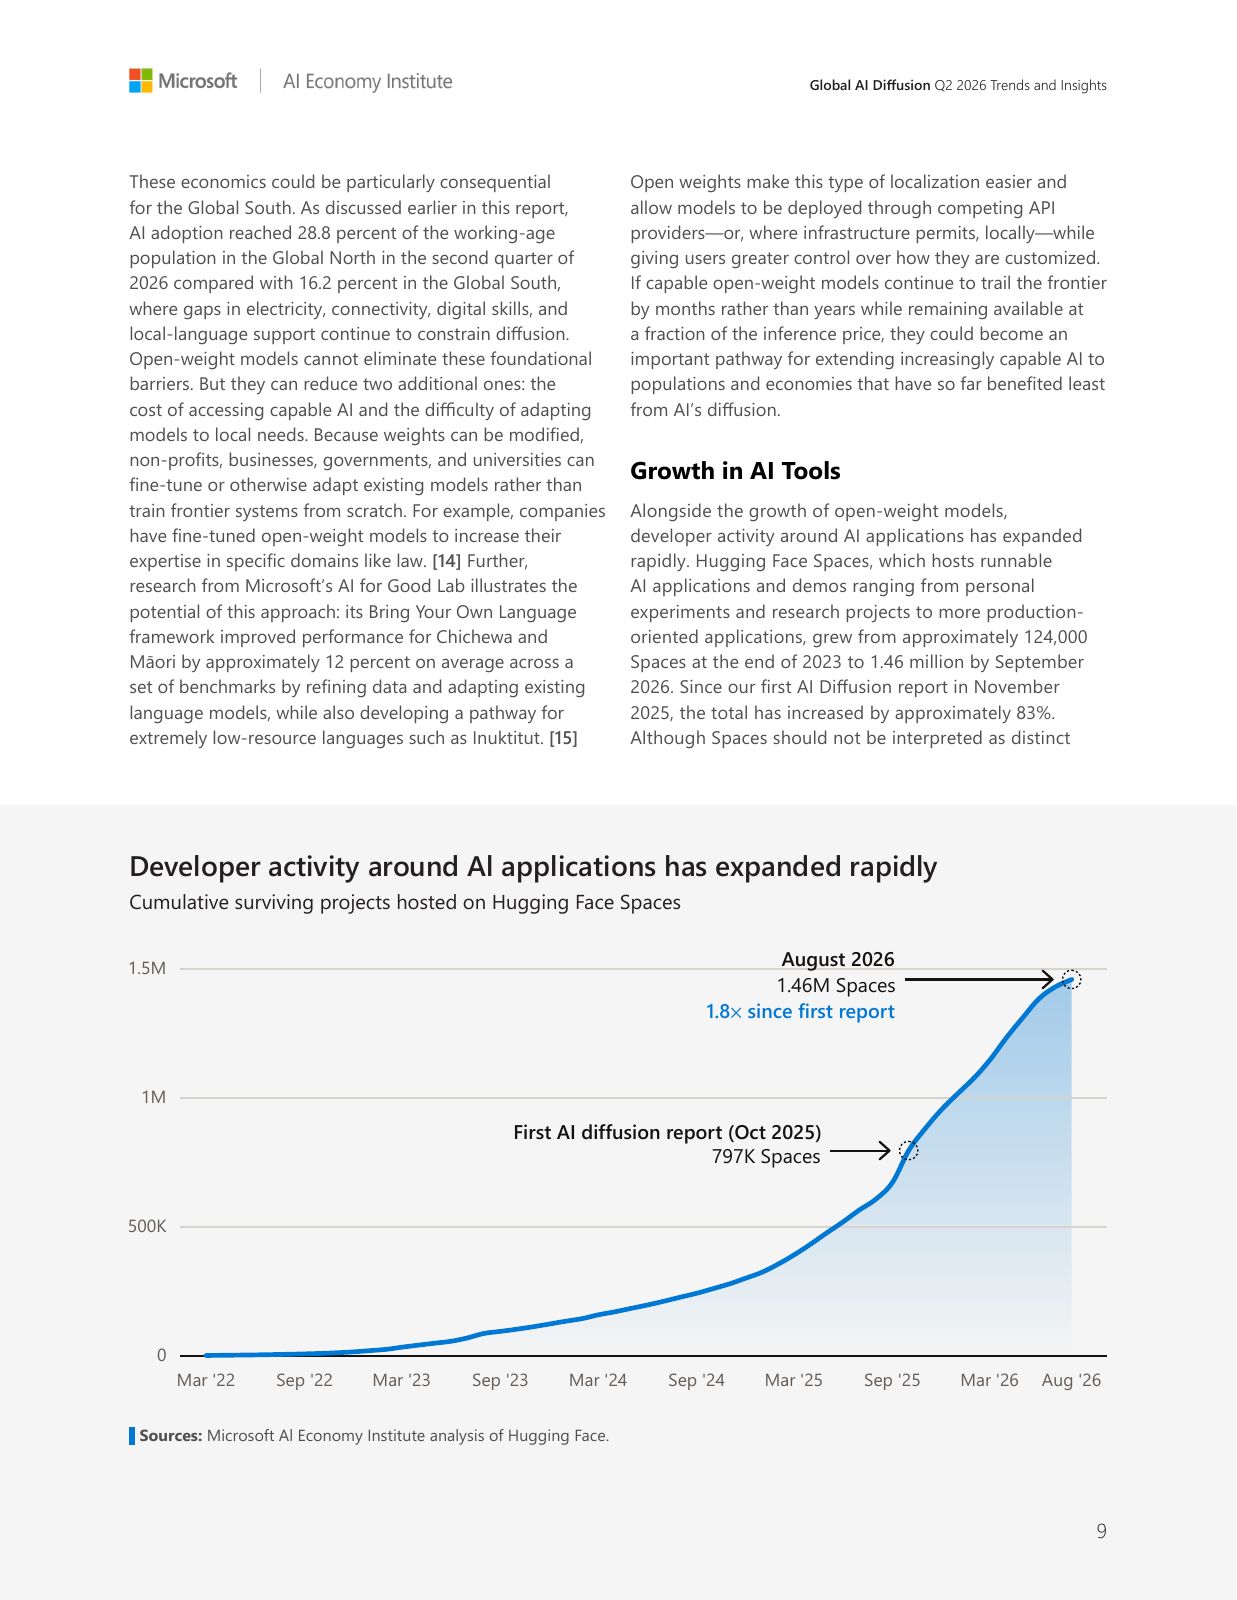

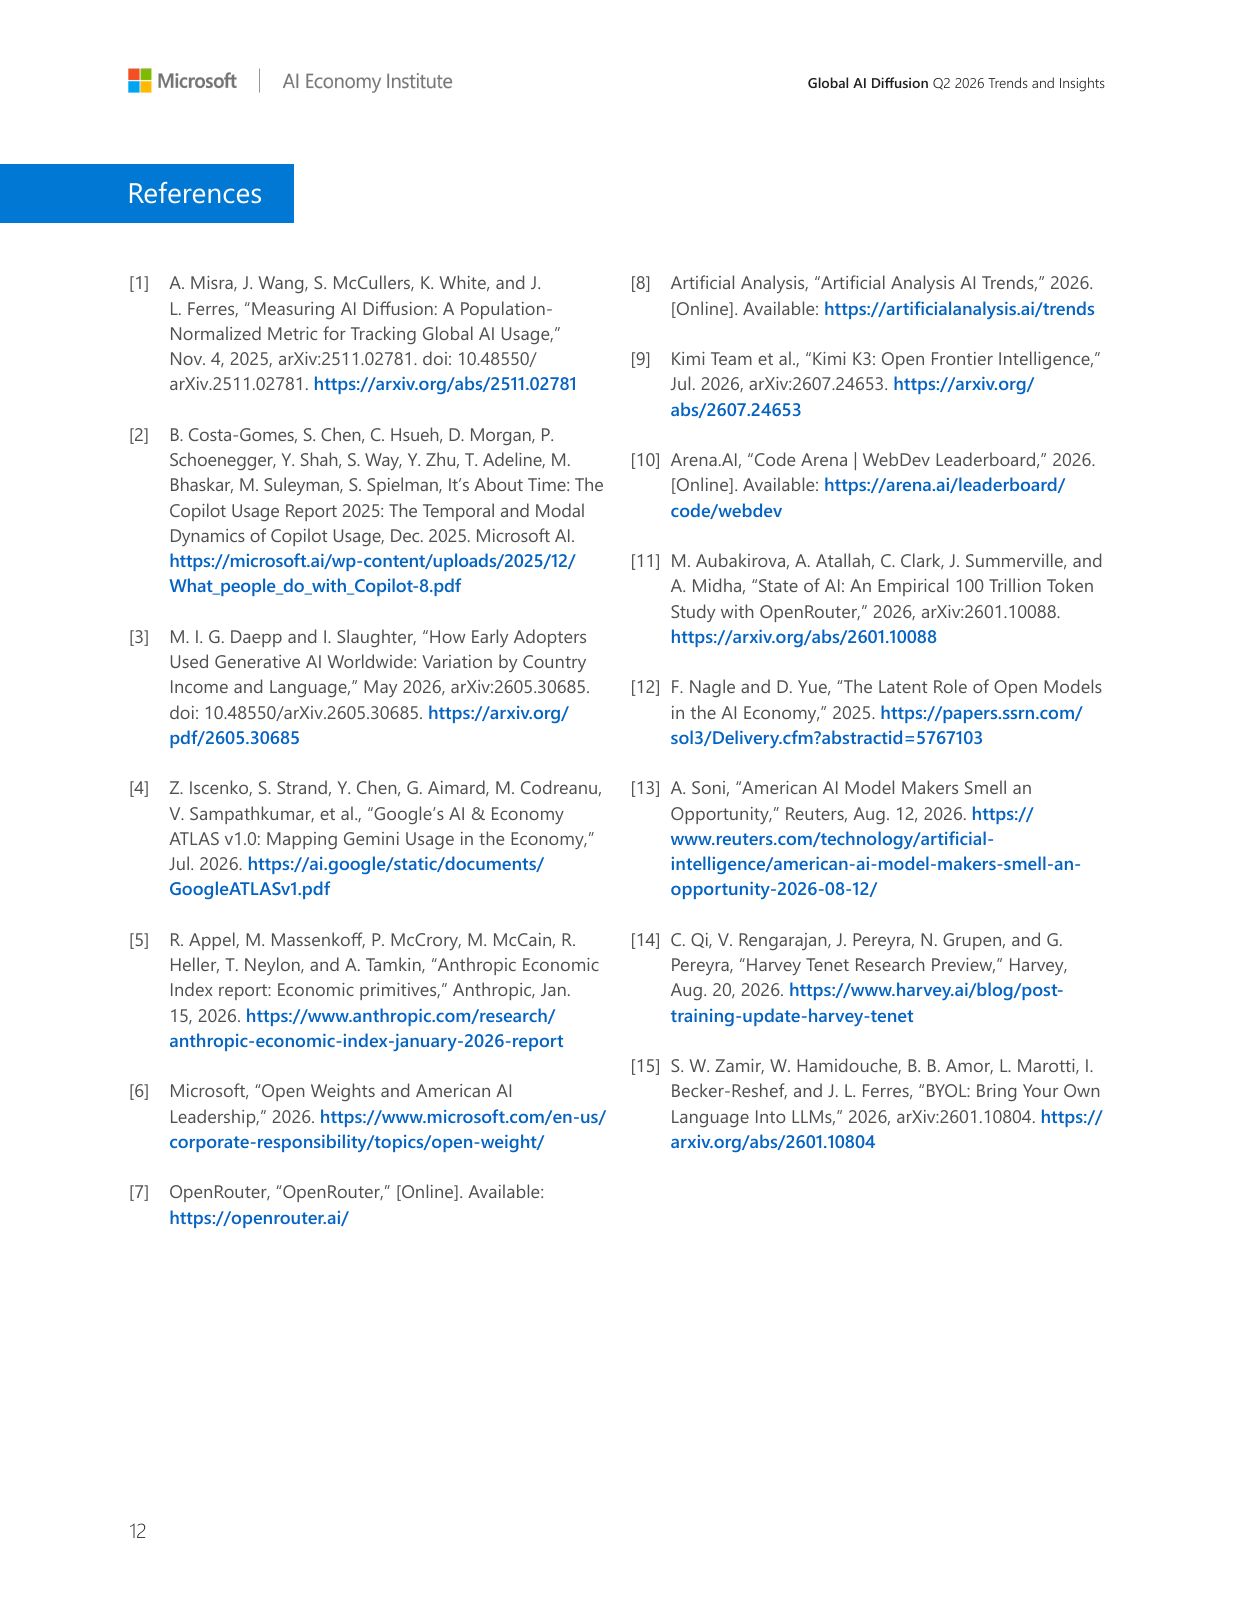
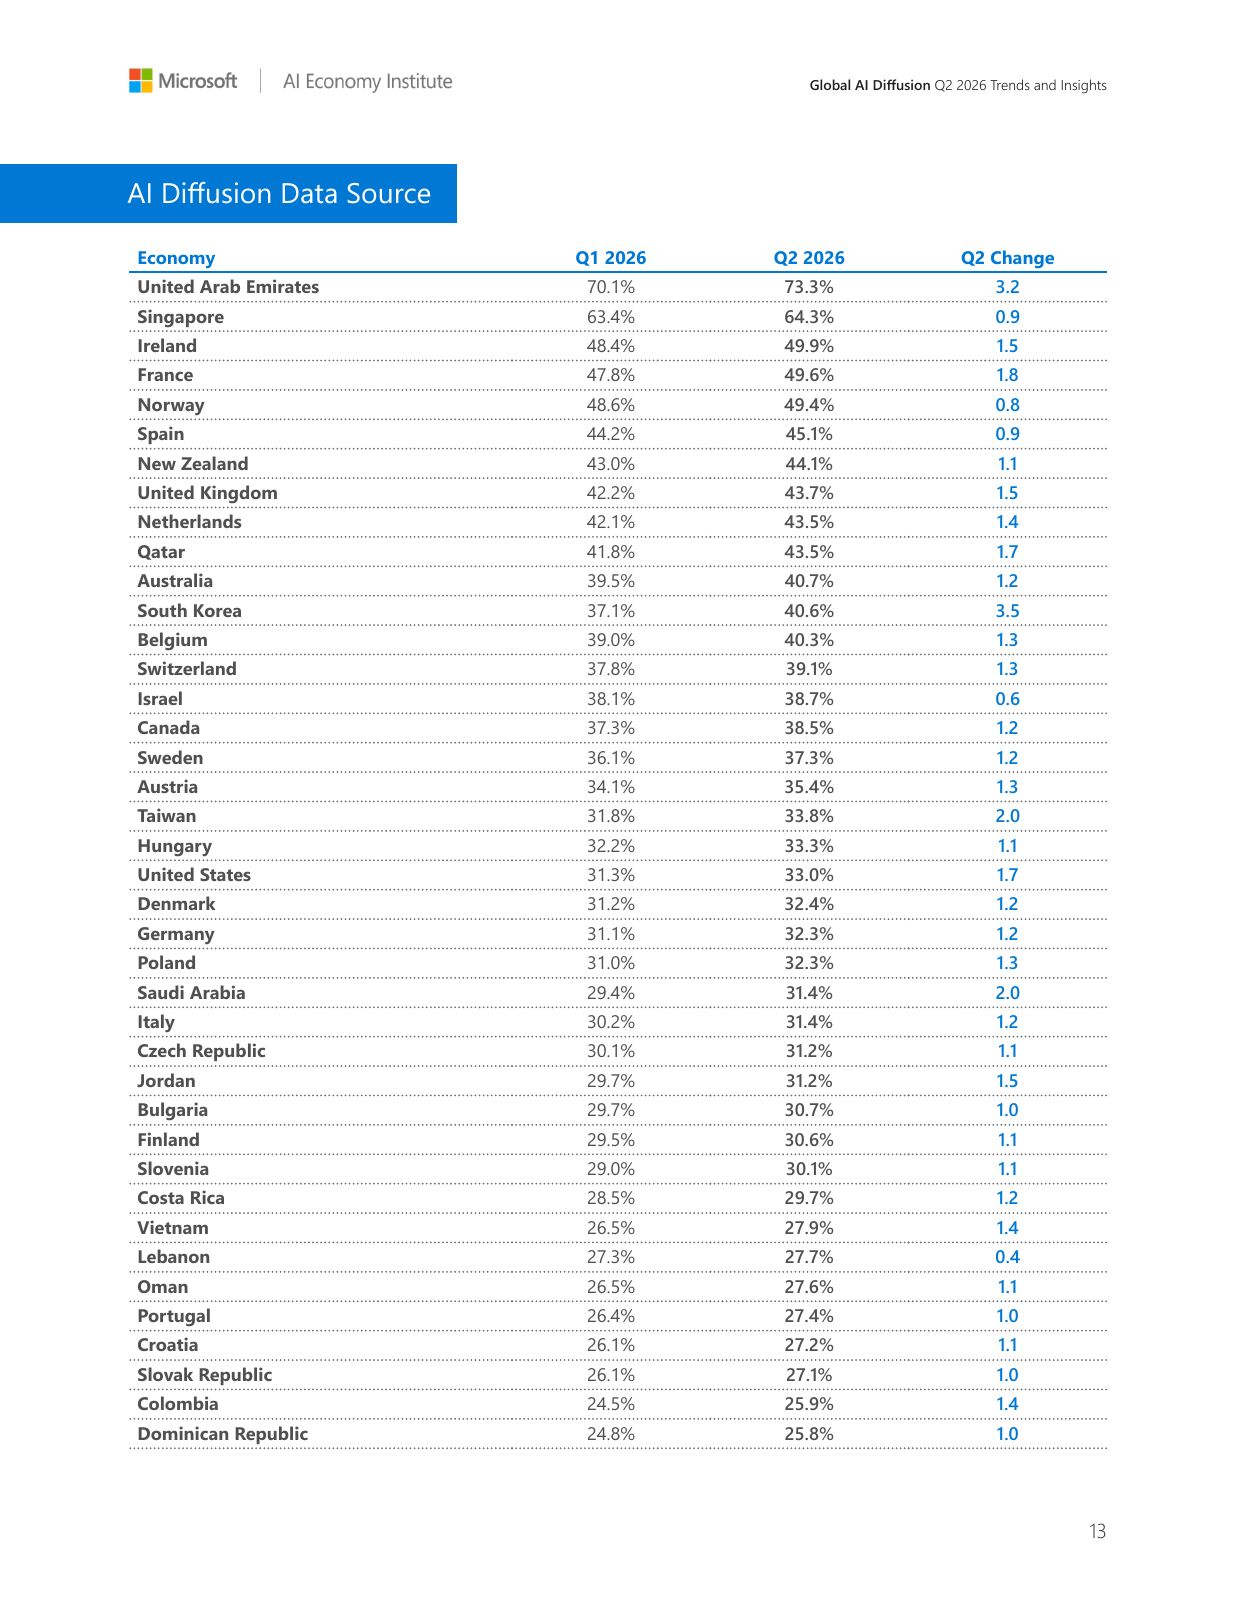
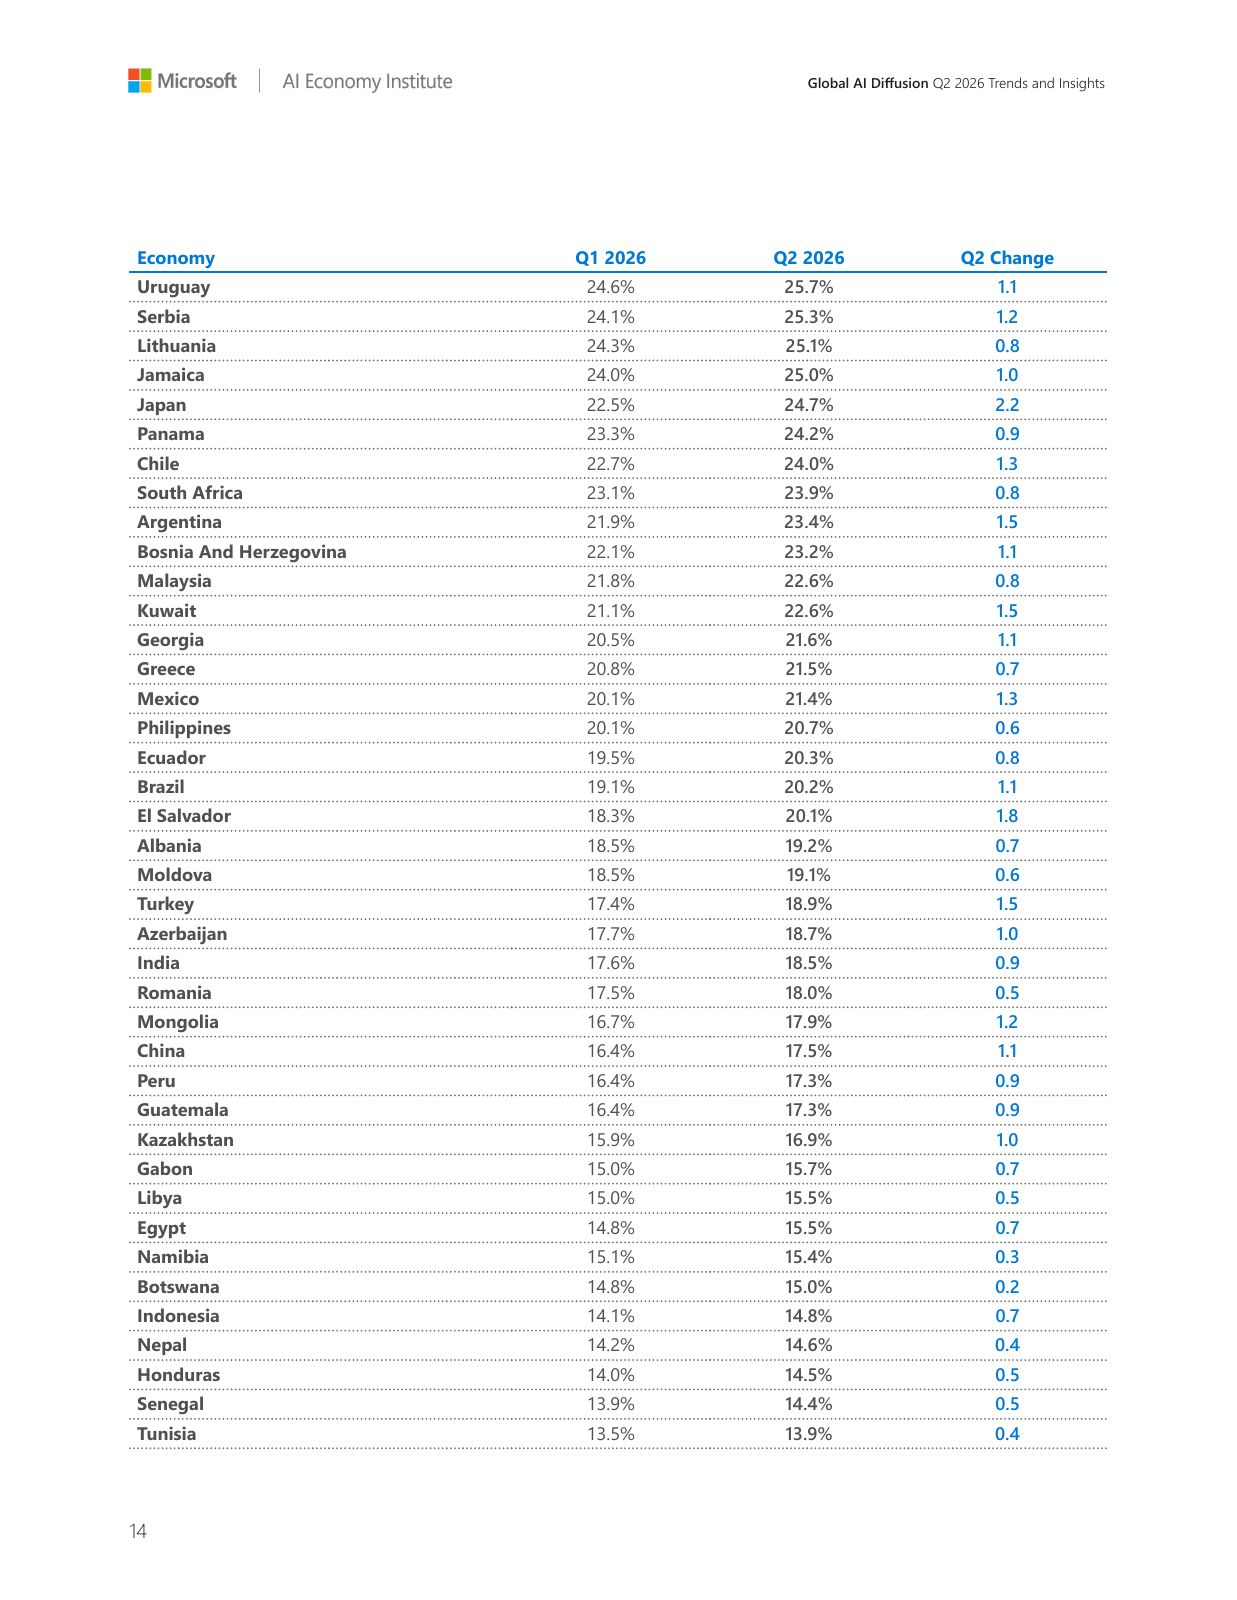
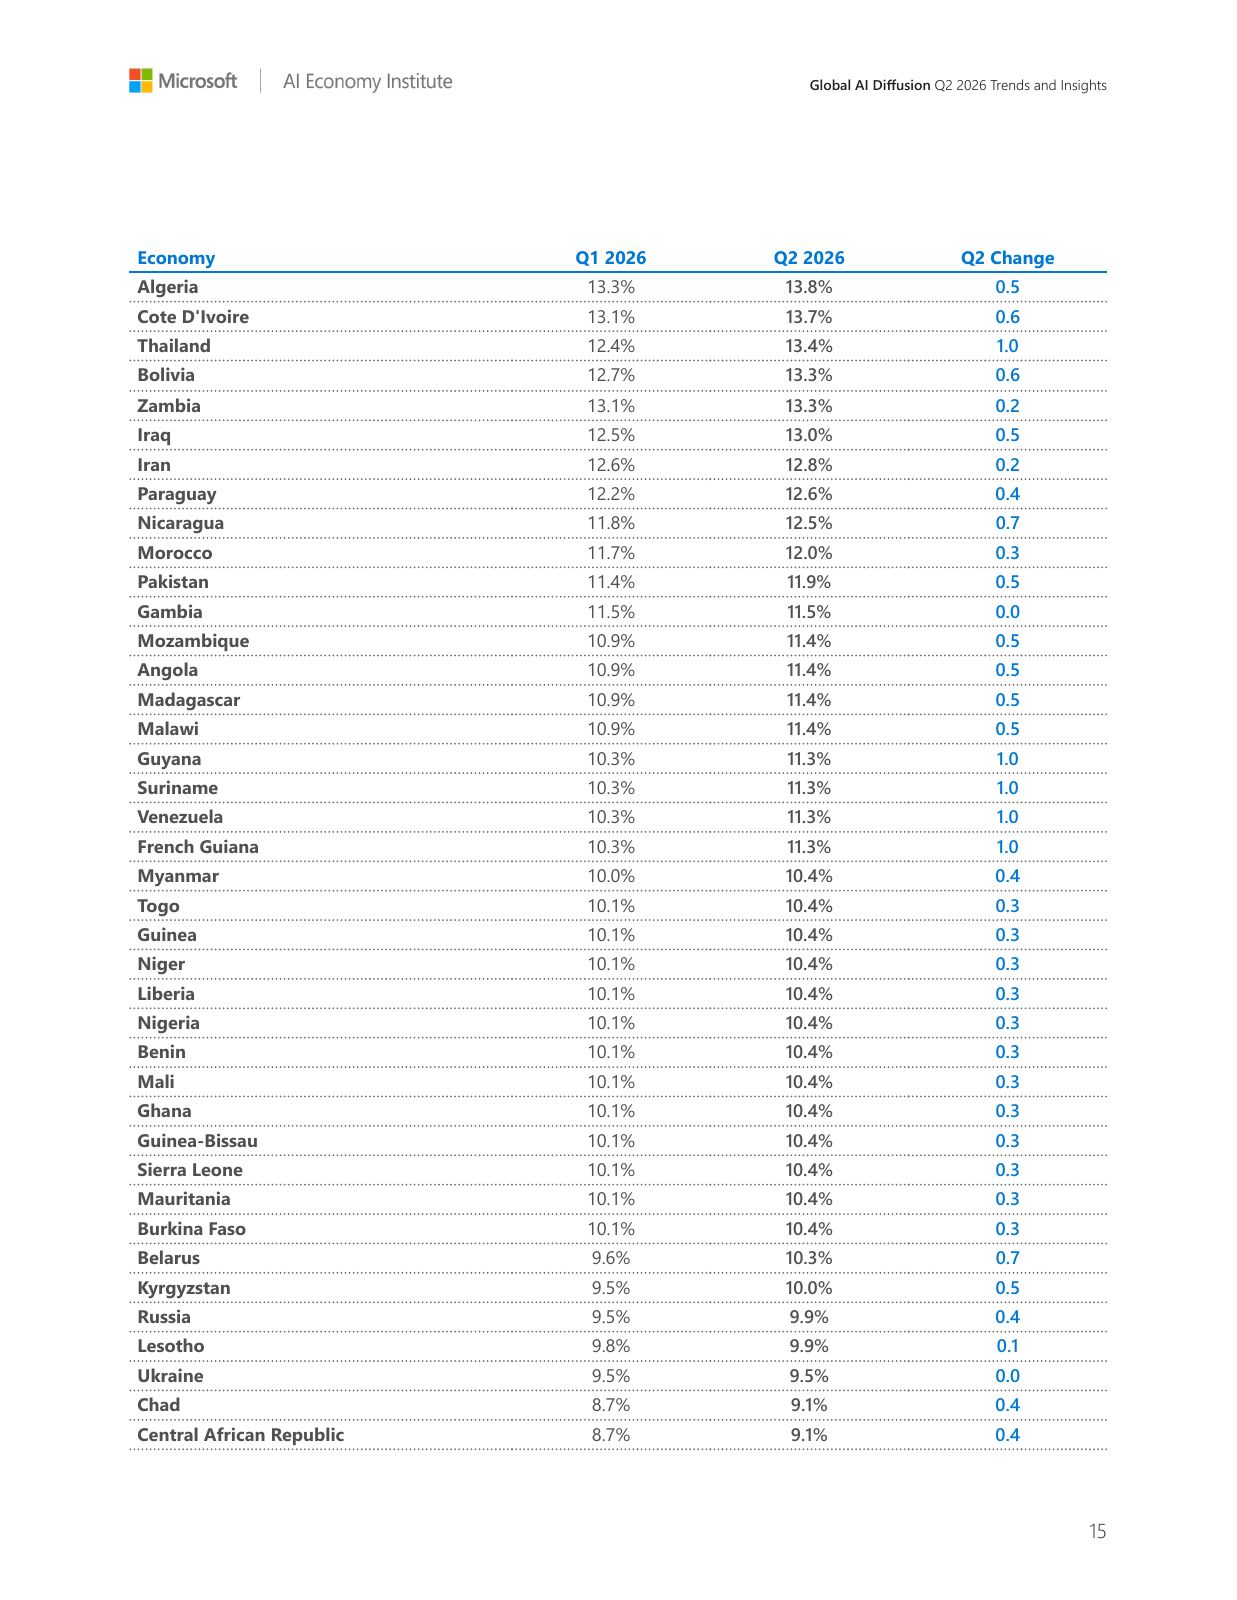
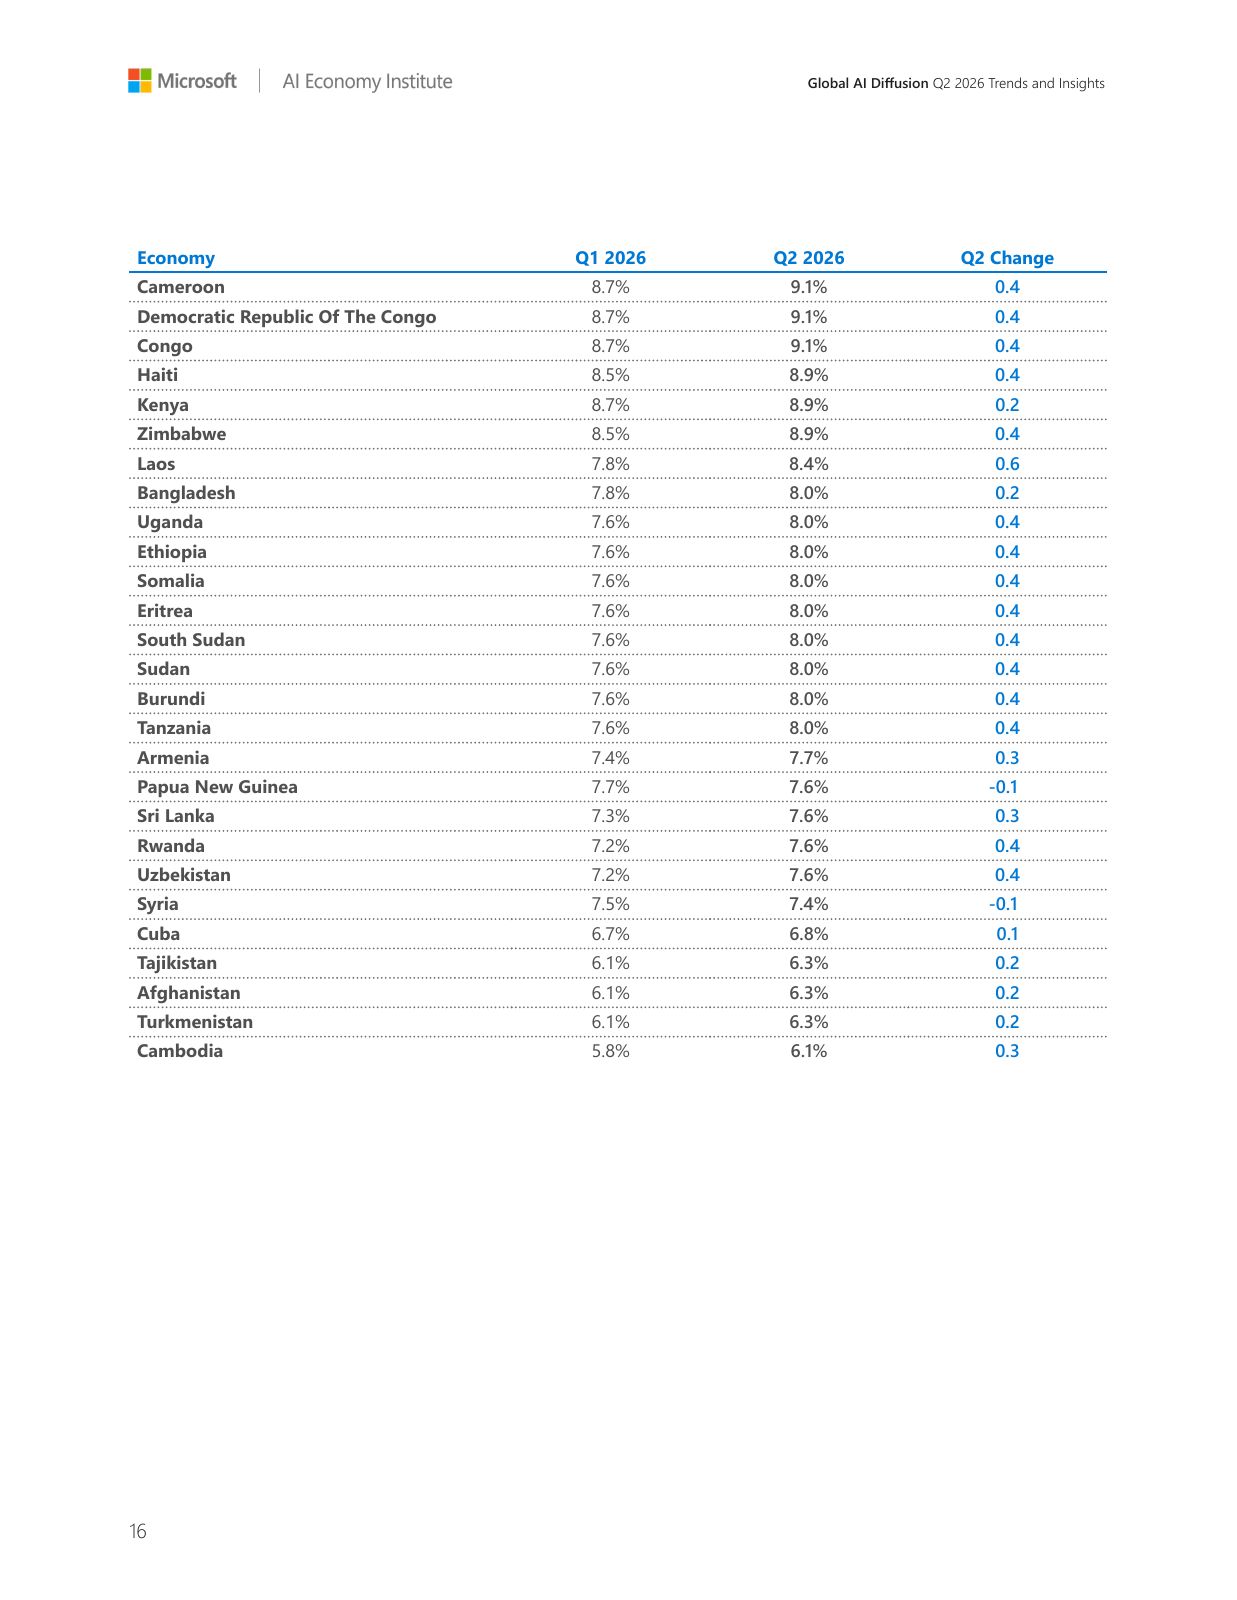

United States · Q1 2026
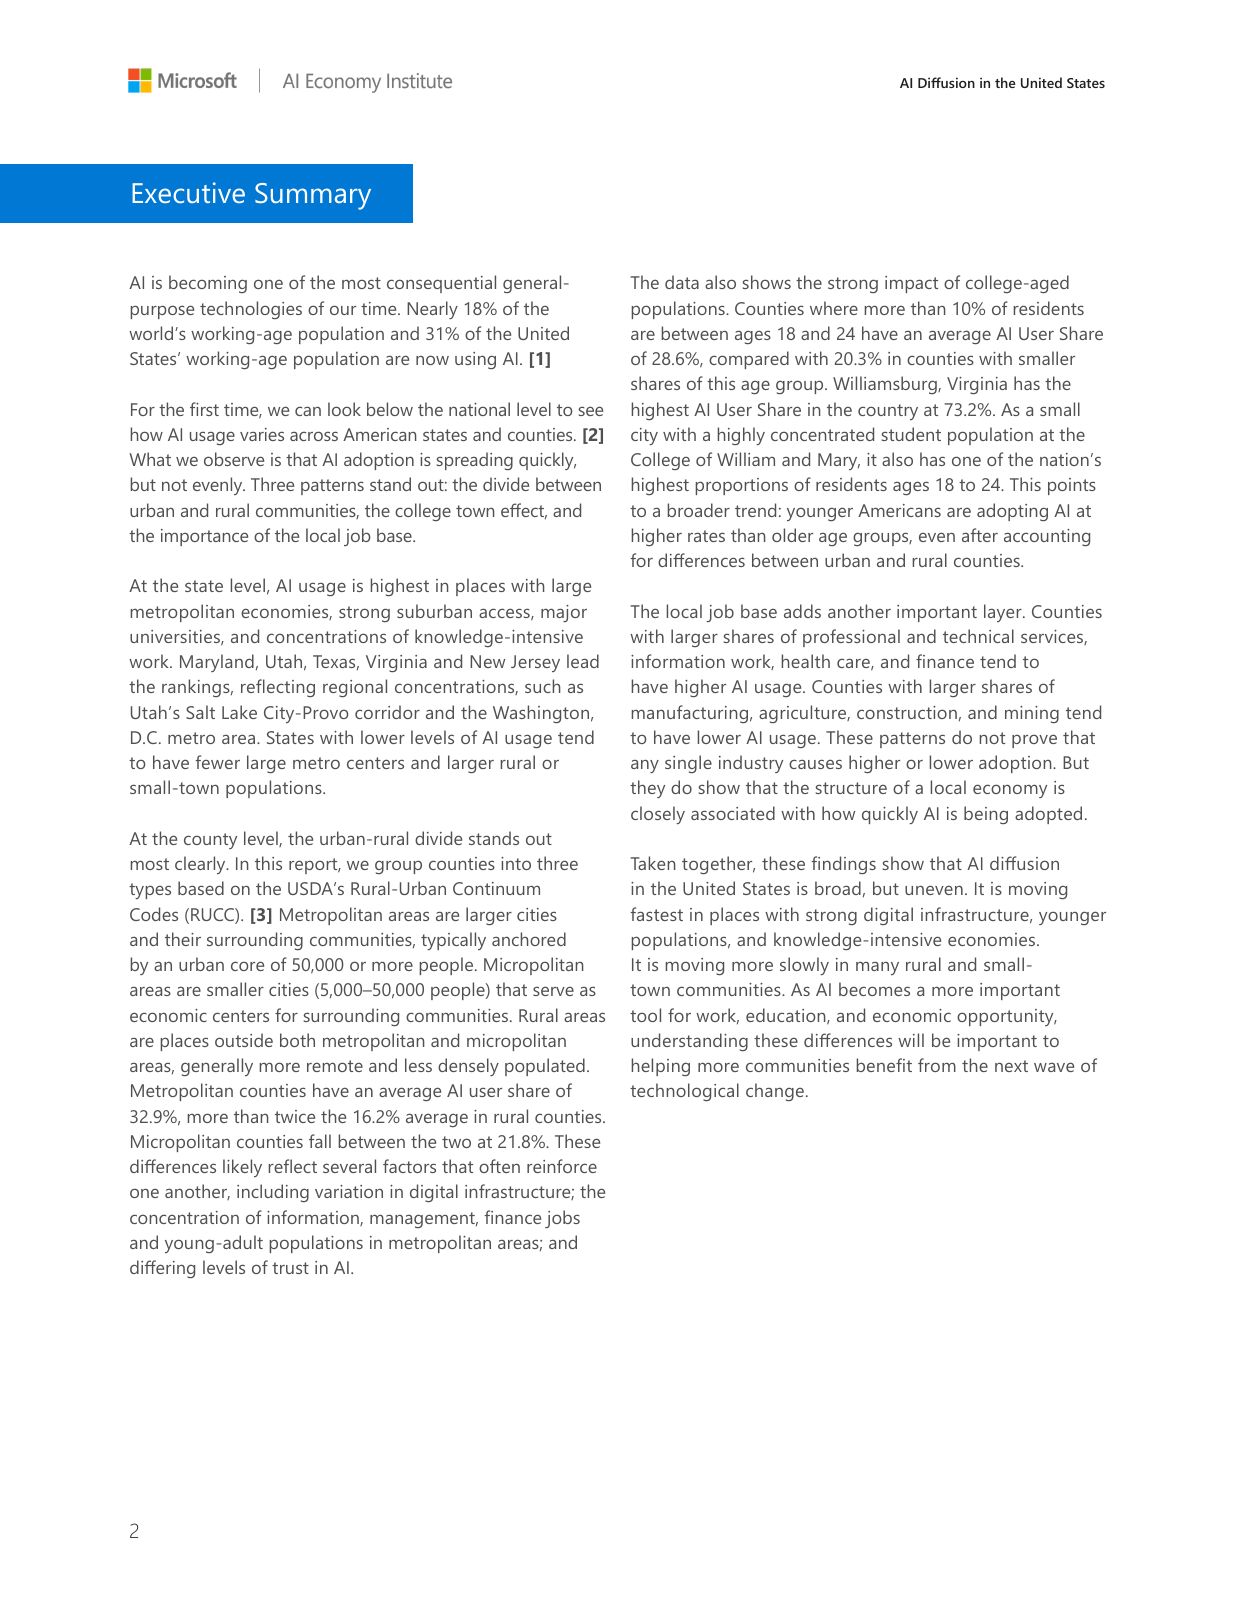
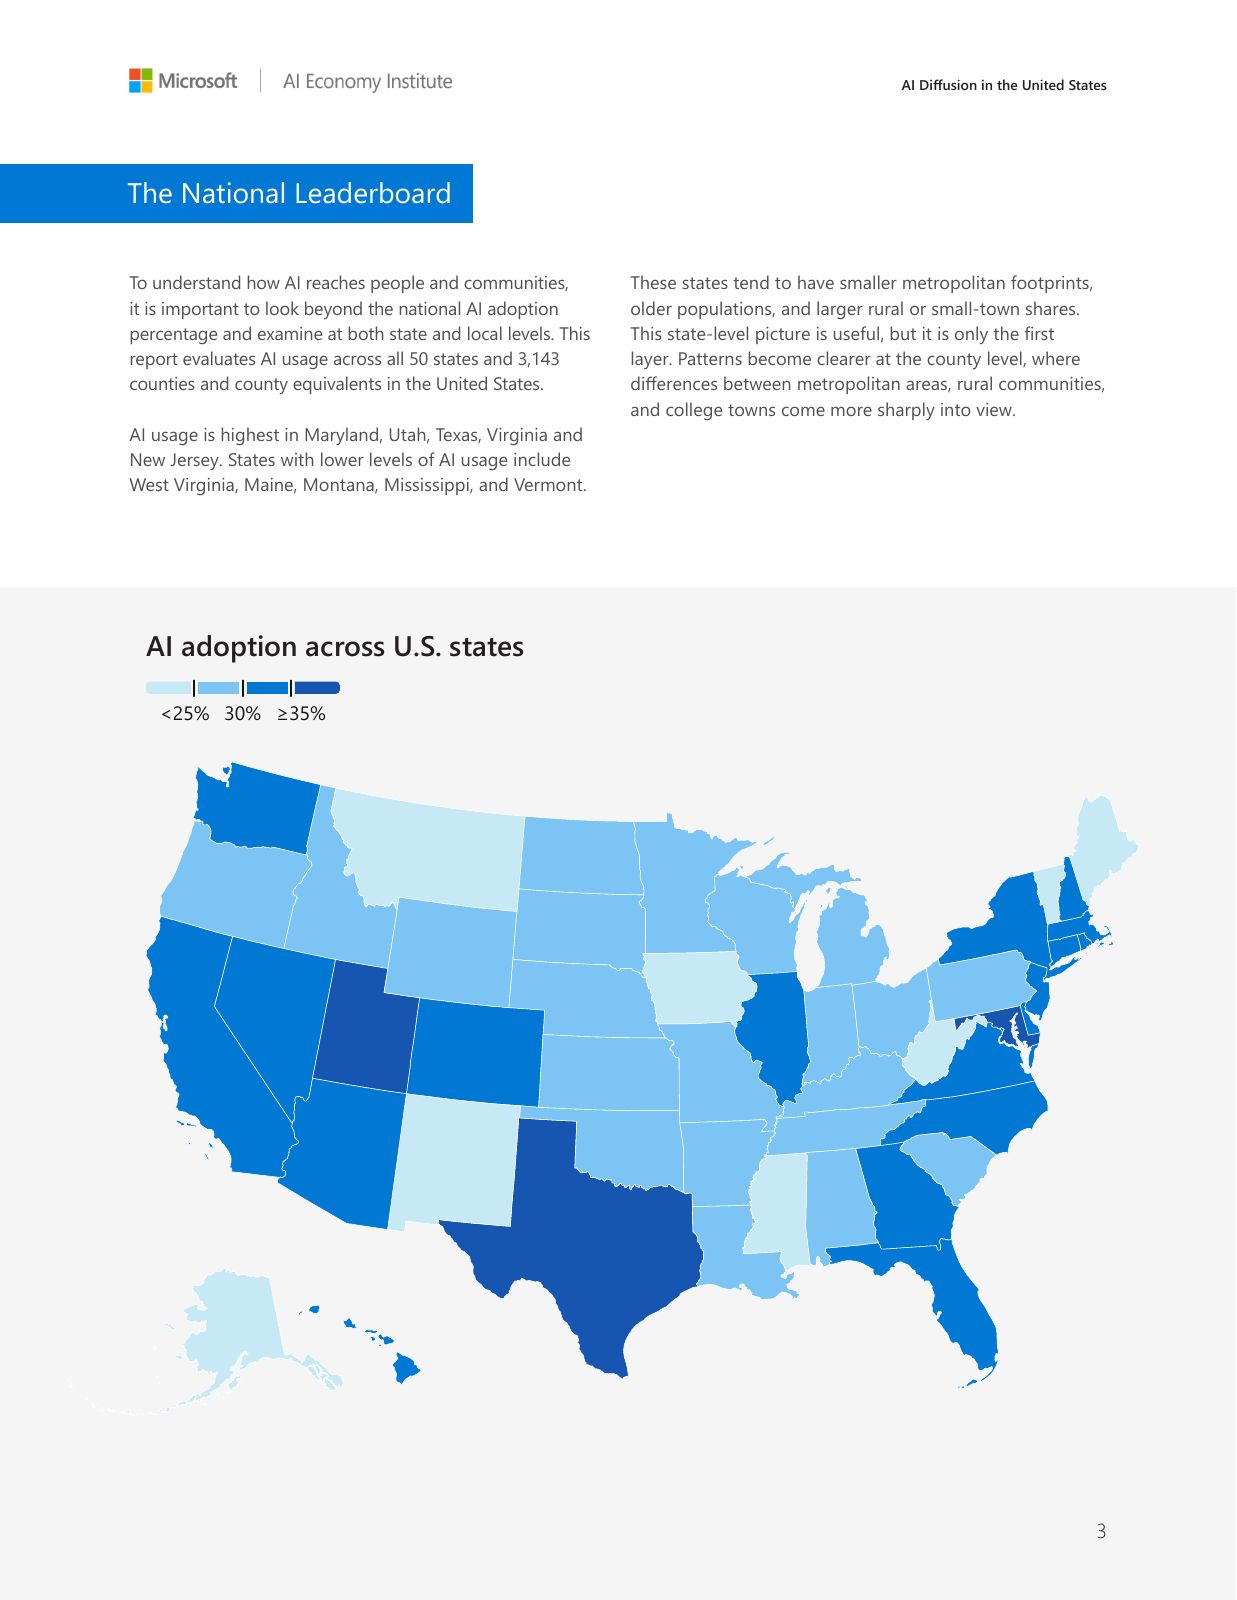
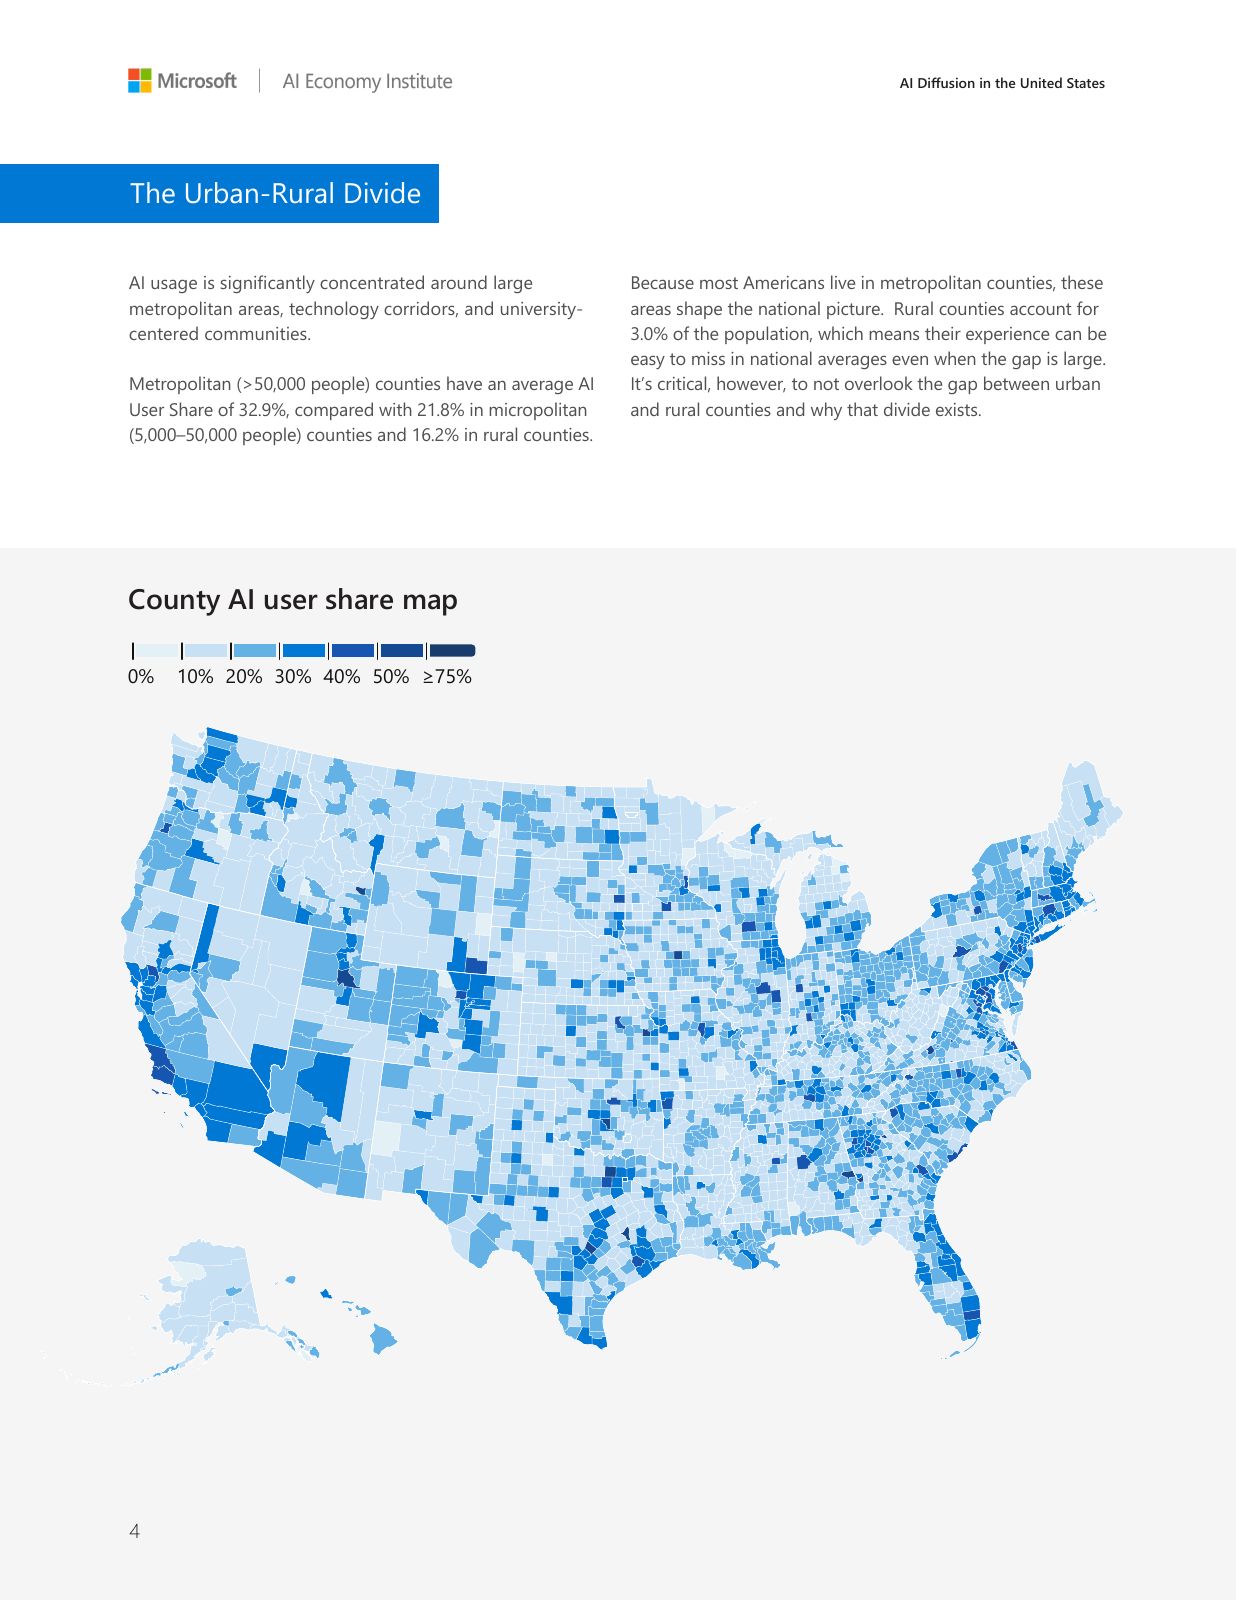
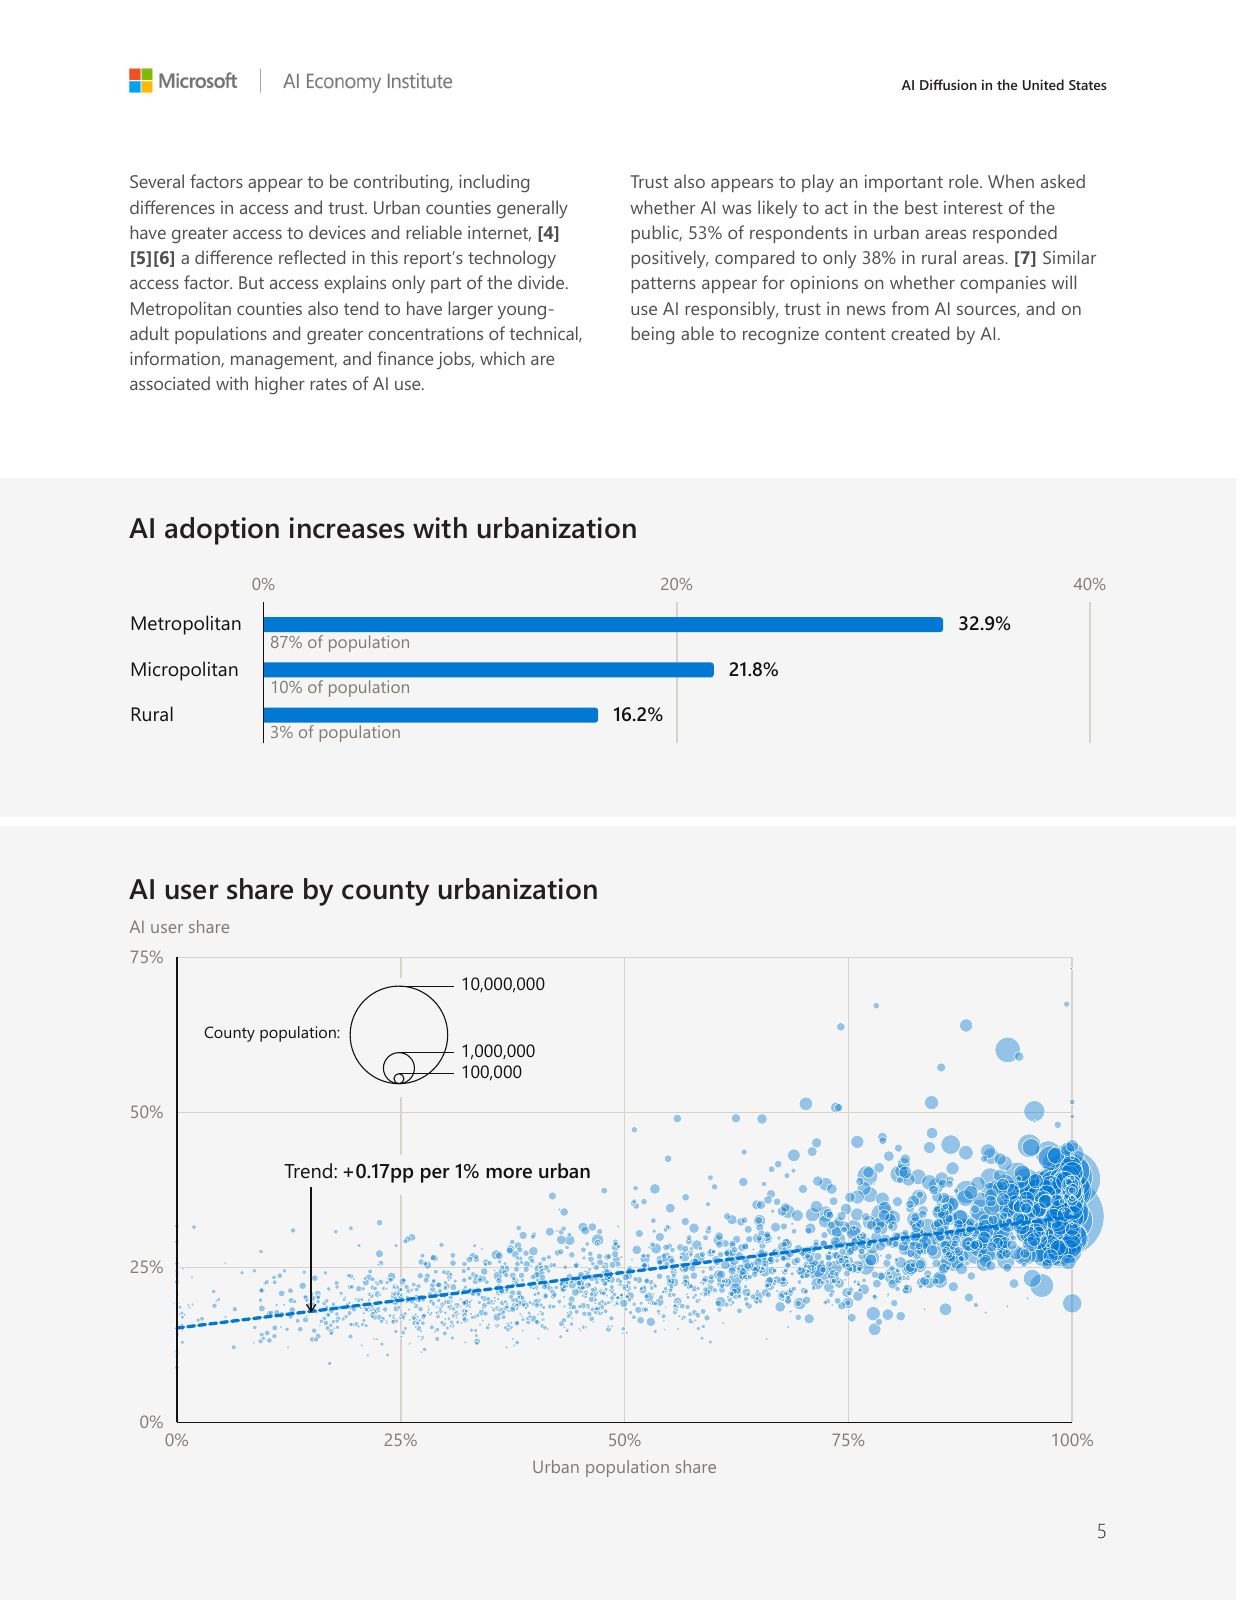
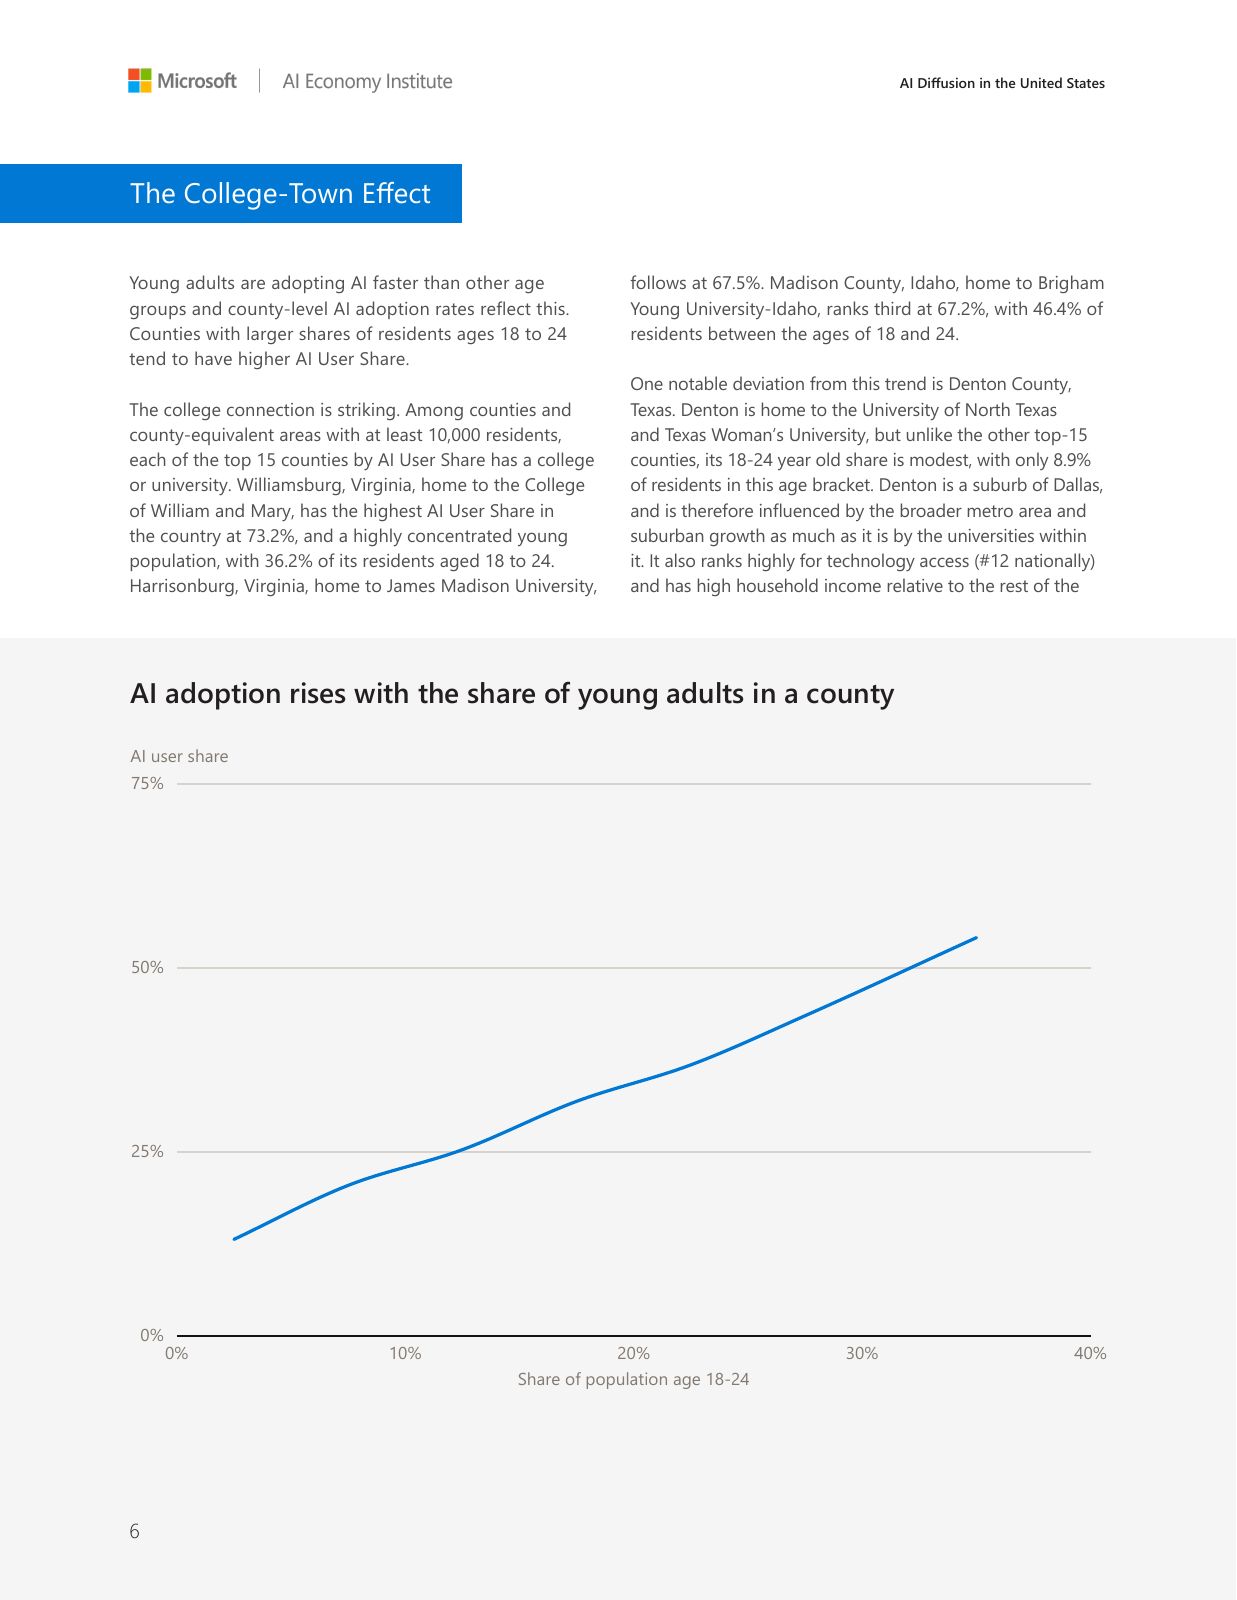
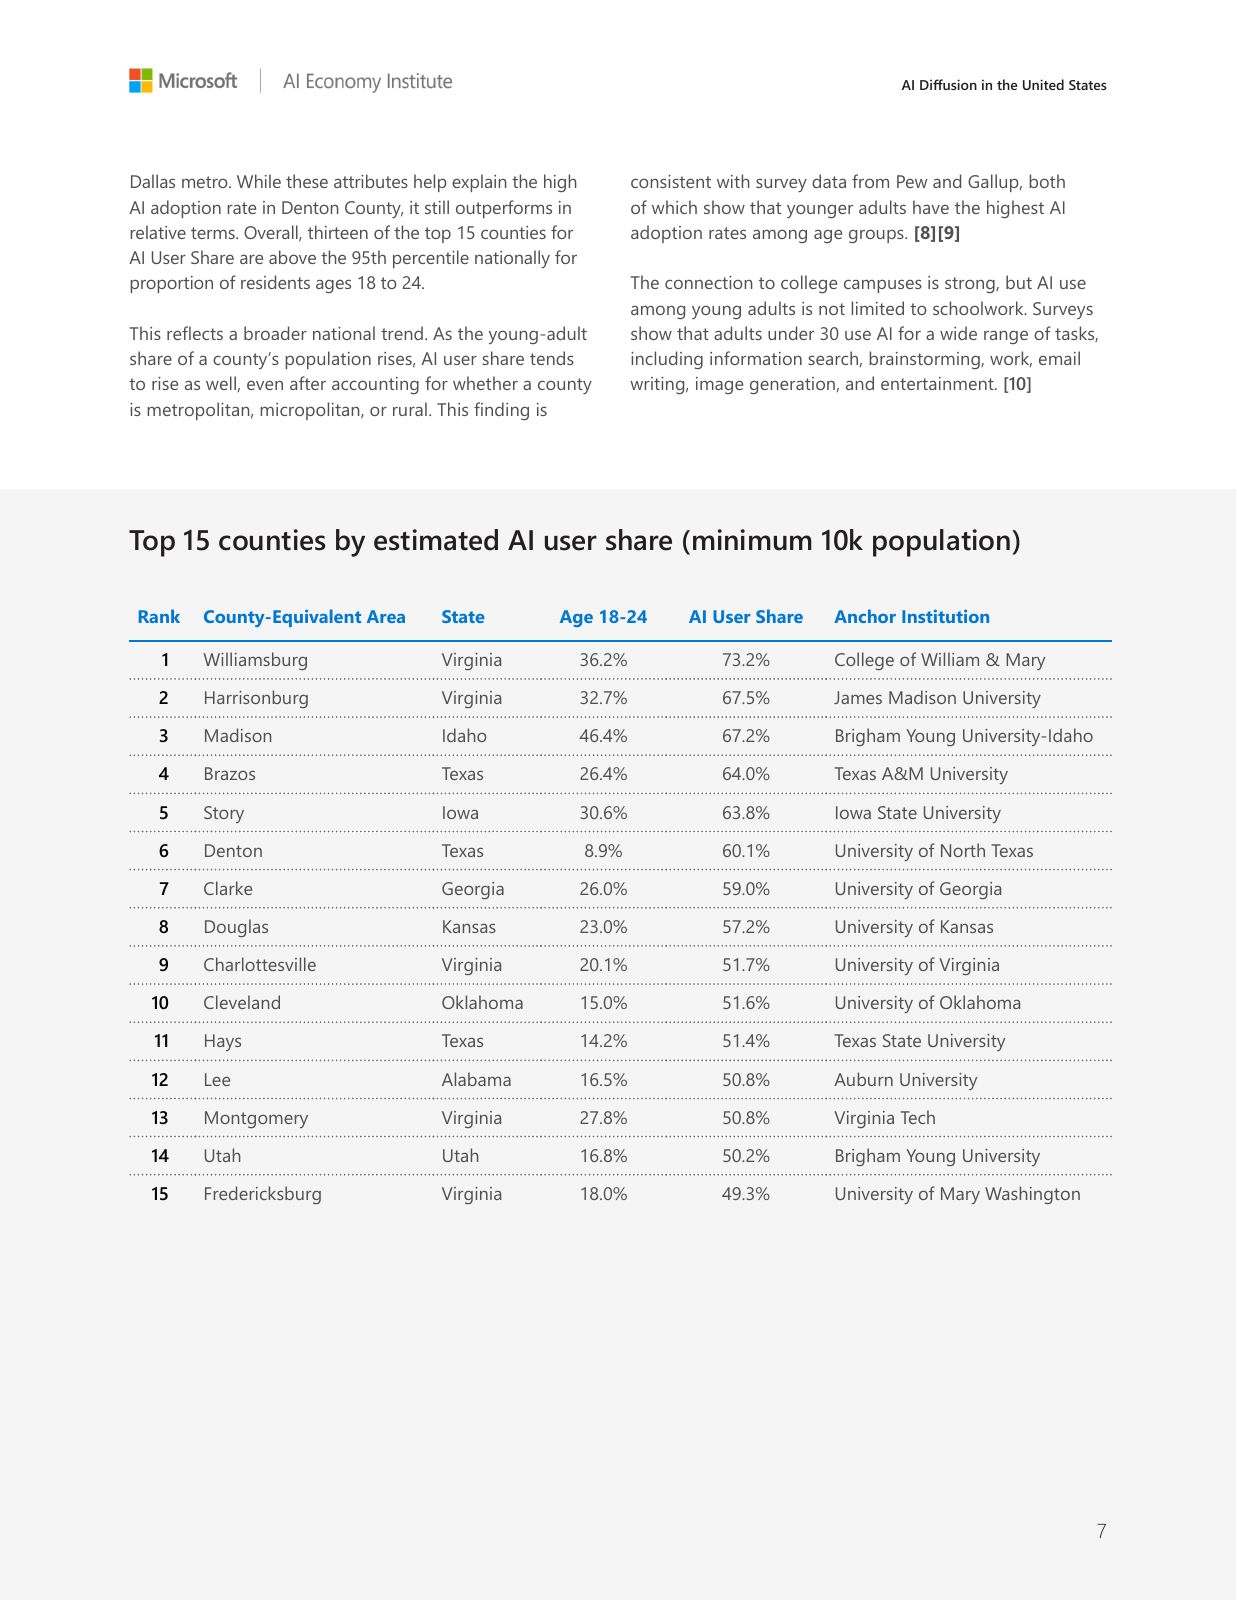
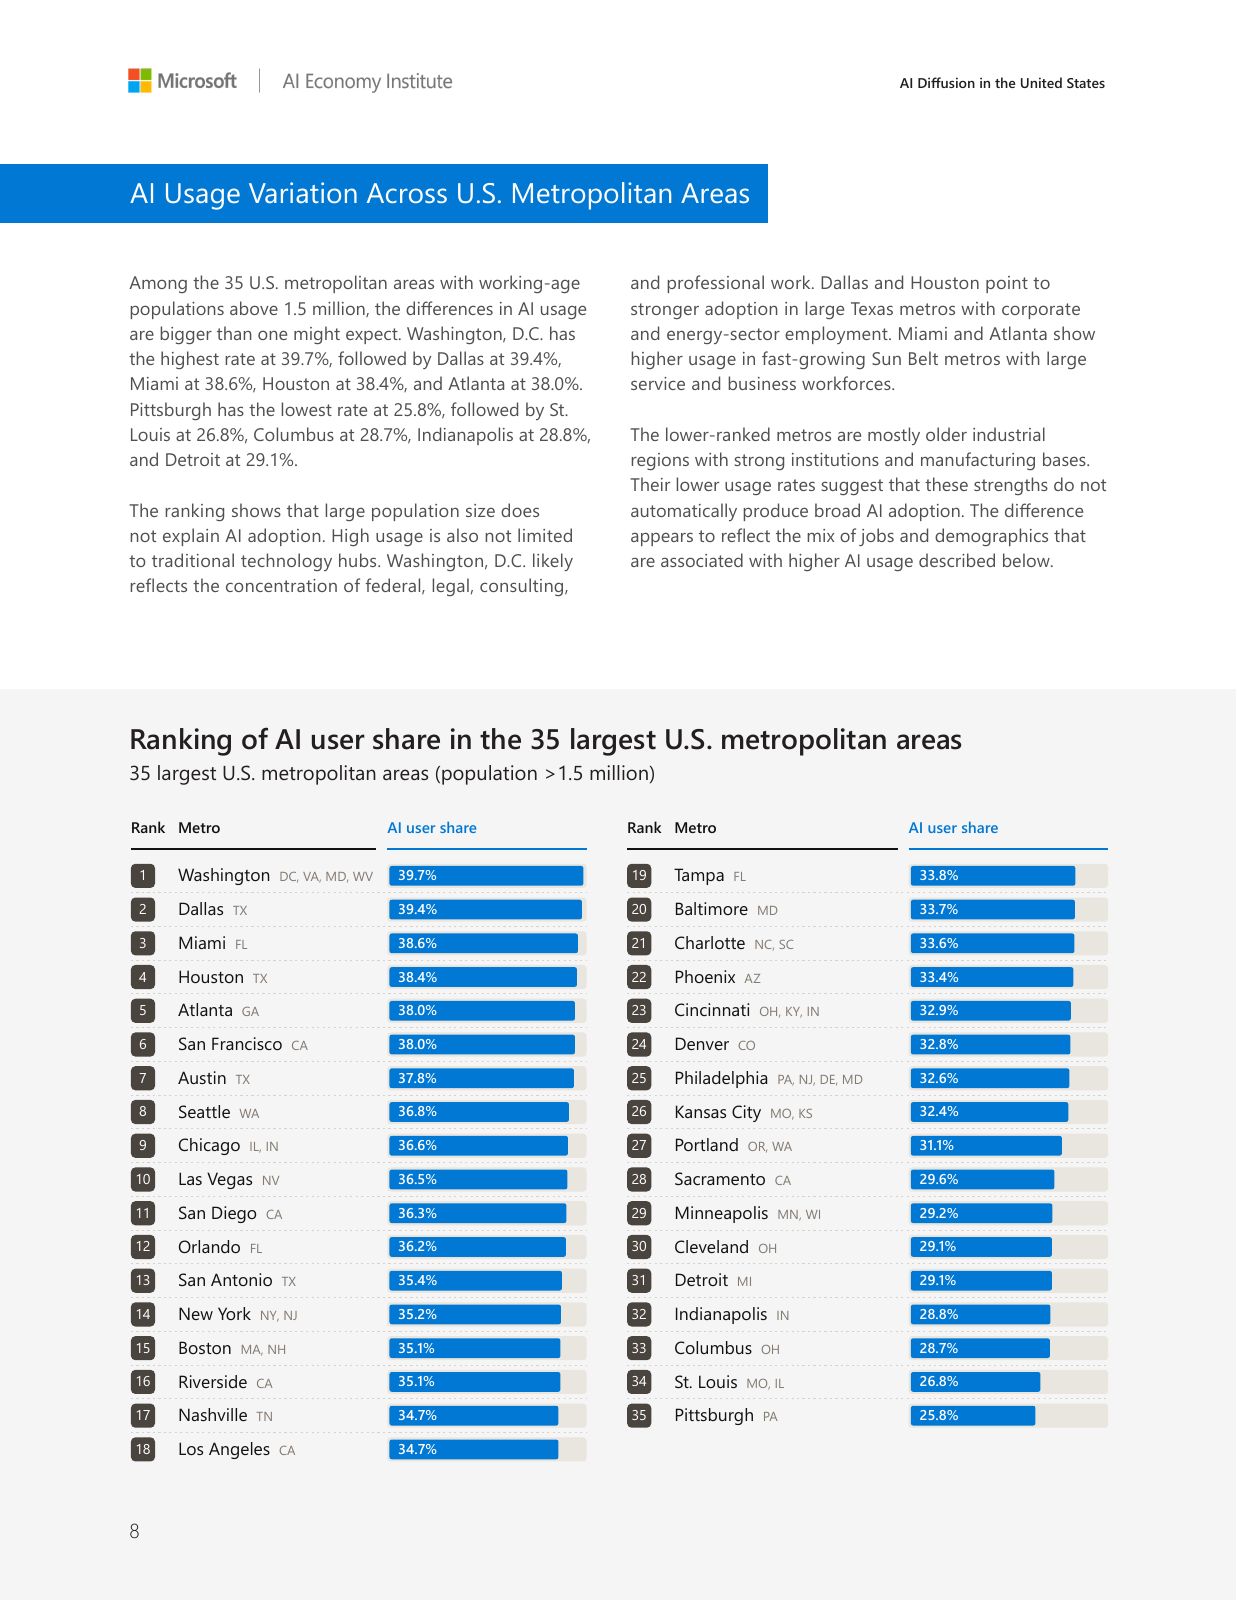
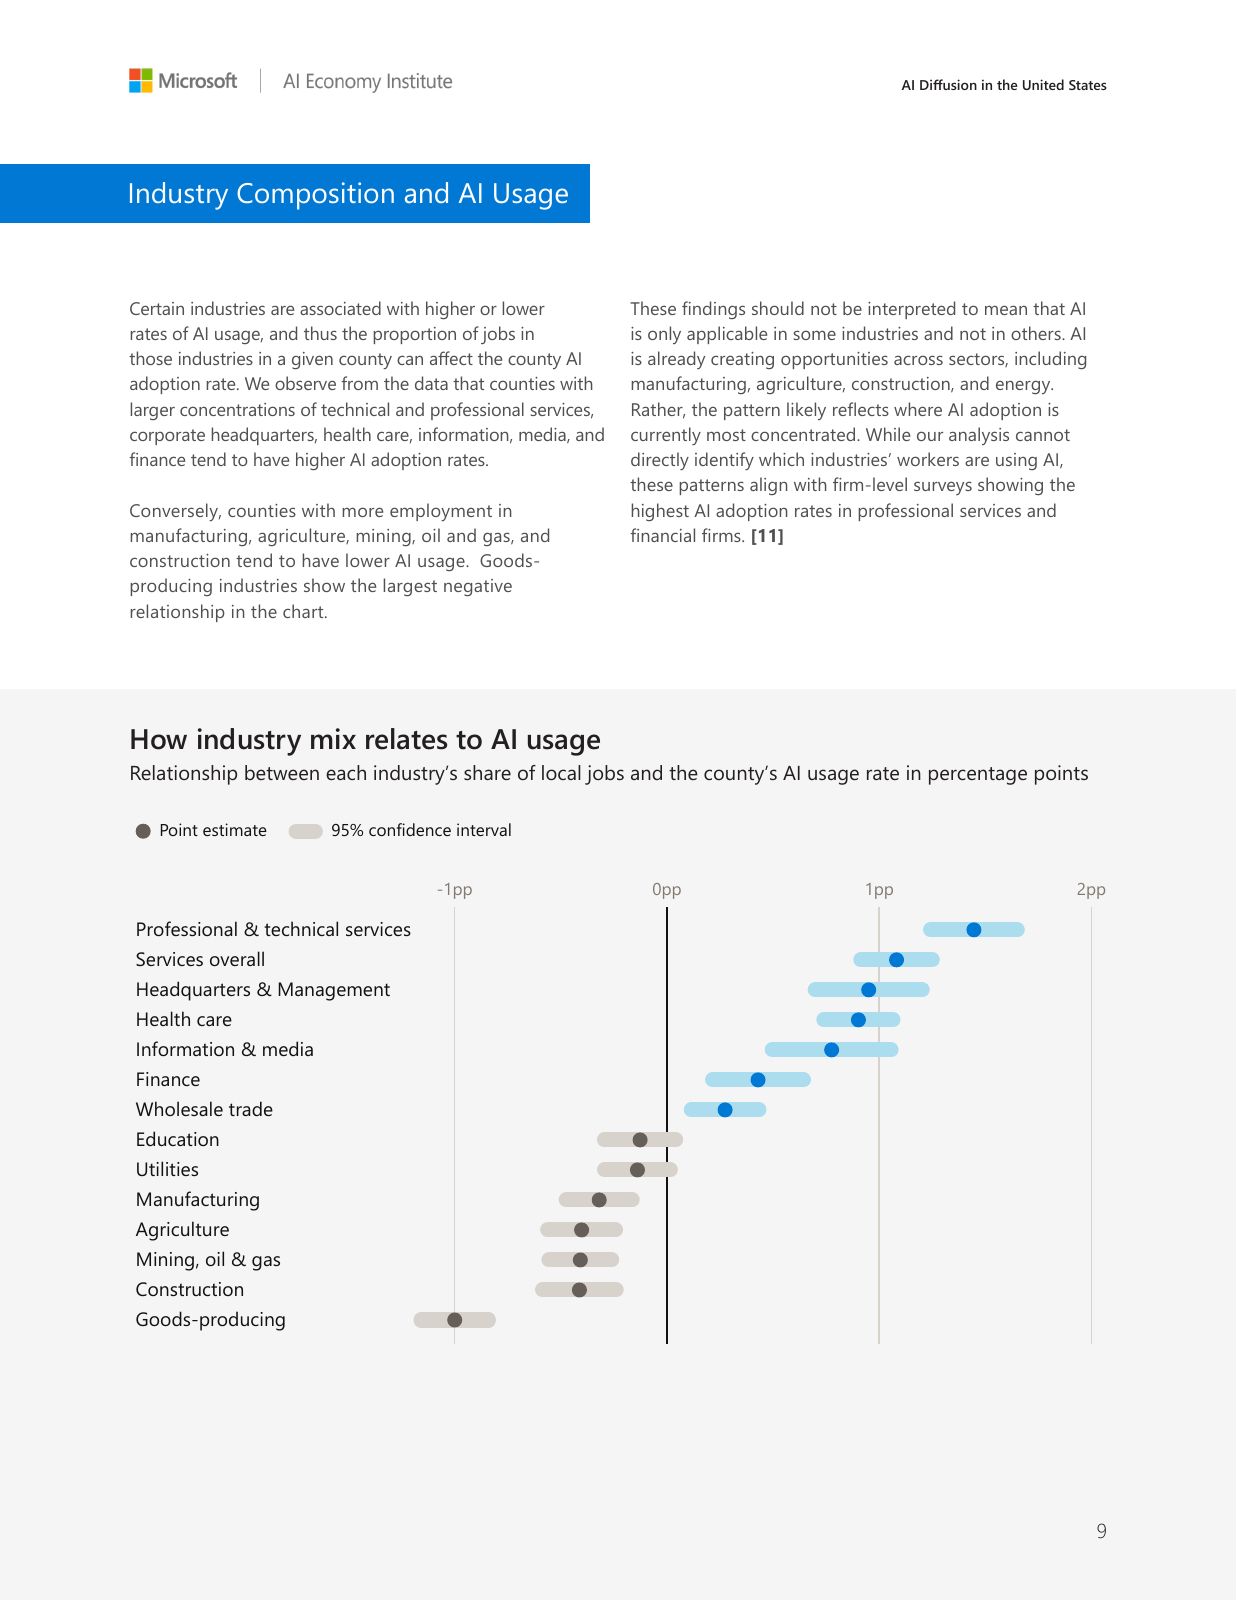

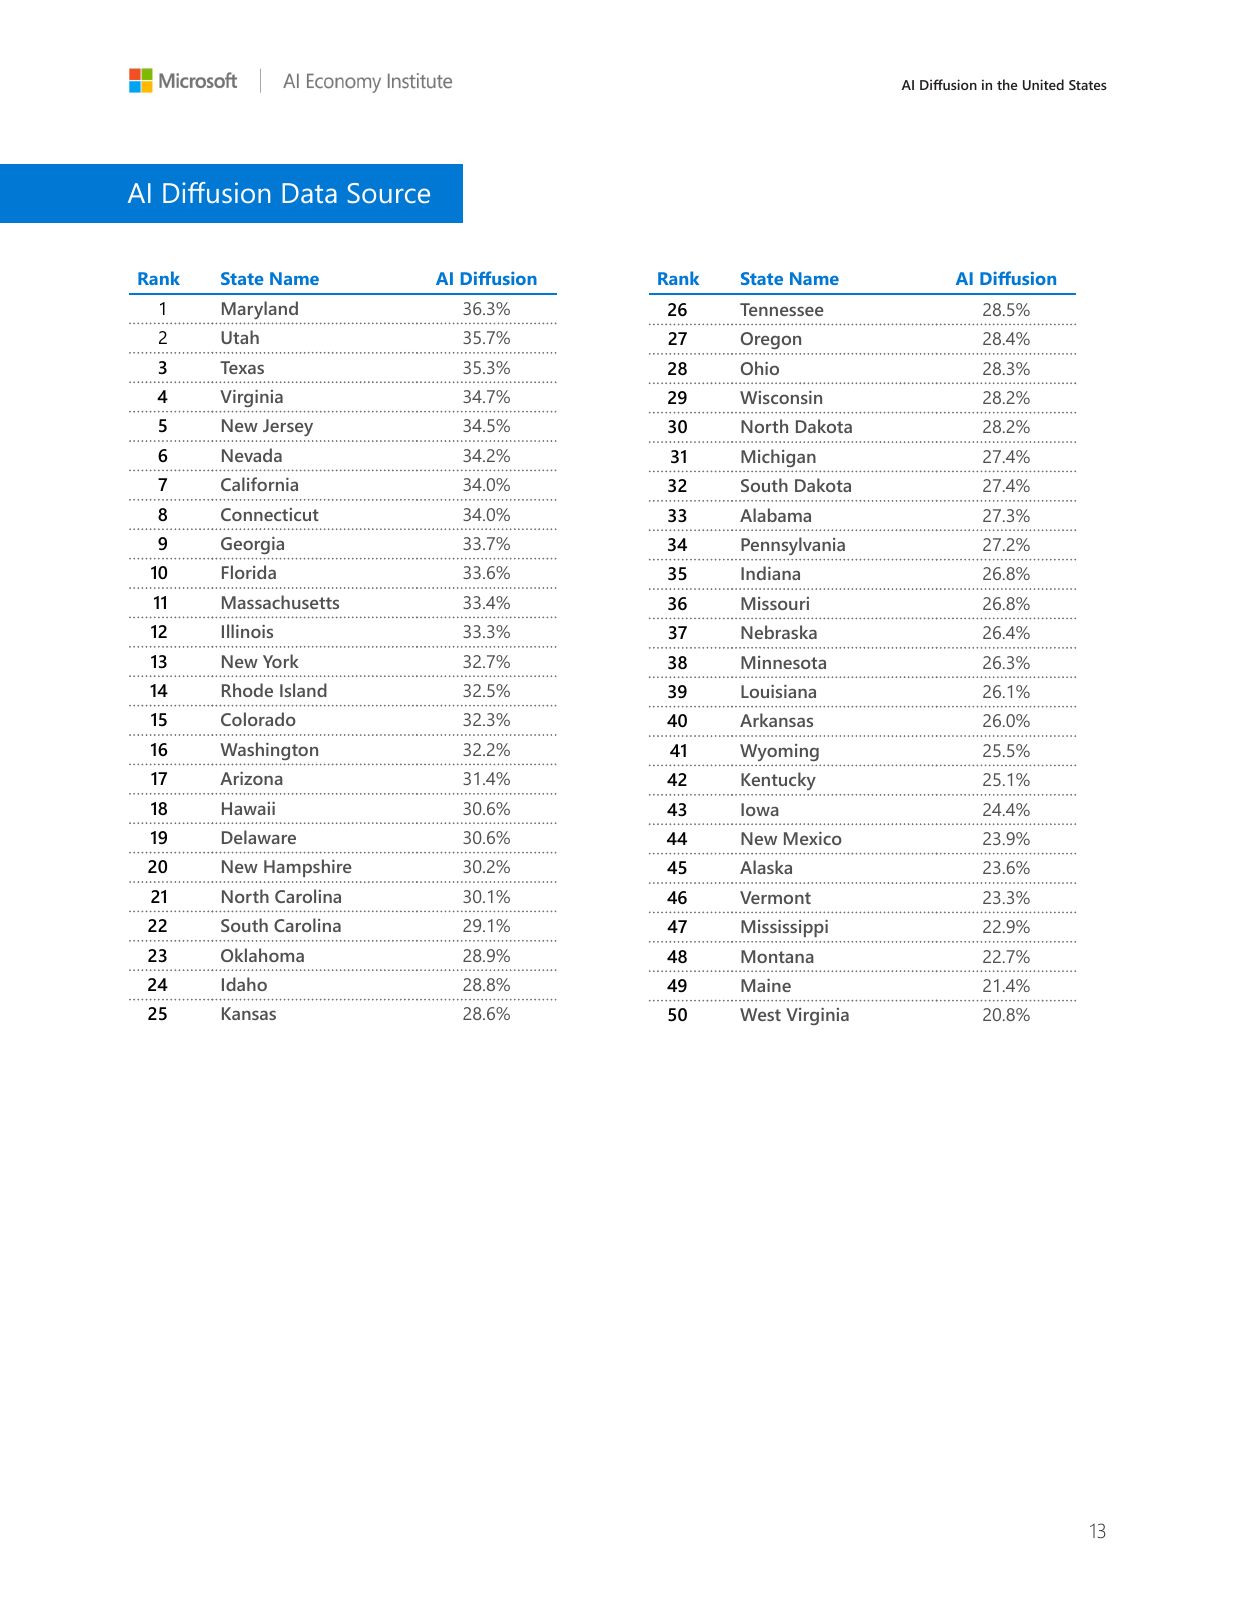

Reusable evidence
Data, reports and source files.
Study / Figure 3 ↗ · Technical appendix ↗ · 16 workflow observations · CSV · Data & provenance · JSON
OECD chapter / Figure 3.4 ↗ · Original workbook ↗ · Workbook snapshot · 29 observations · CSV · Data & provenance · JSON
5 November release ↗ · Survey notes ↗ · Methodology ↗ · National workbook snapshot · Two observations · CSV · Data & provenance · JSON
Original source bytes are retained. JSON representations and text extracts are supplied separately; they do not replace the original reports.
Microsoft geographic data
- Global · 147 economiesOriginal CSV · JSON
- United States · 50 states + DCOriginal CSV · JSON
- United States · 35 metrosOriginal CSV · JSON
- United States · 3,143 countiesOriginal CSV · JSON
- All four datasets · 3,376 recordsCombined JSON
Survey, sector and geographic evidence
Five original reports
- Global · H1 2025 24 pagesPDF · Text · Page-text JSON
- Global · H2 2025 18 pagesPDF · Text · Page-text JSON
- Global · Q1 2026 21 pagesPDF · Text · Page-text JSON
- Global · Q2 2026 17 pagesPDF · Text · Page-text JSON
- United States · Q1 2026 14 pagesPDF · Text · Page-text JSON
Transcriptions and provenance
Original source-file catalogue · 12 files
- LICENSE.md1,070 bytes
- README.md3,542 bytes
- SECURITY.md542 bytes
- data/AI_Diffusion_Q22026_Update.csv5,346 bytes
- data/US/County_AI_User_Share_2026Q1.csv112,790 bytes
- data/US/MSA_Ranking_2026Q1.csv1,628 bytes
- data/US/State_Rankings_2026Q1.csv1,133 bytes
- reports/Microsoft-AI-Diffusion-Report-2025-H1.pdf7,746,221 bytes
- reports/Microsoft-AI-Diffusion-Report-2025-H2.pdf1,895,779 bytes
- reports/Microsoft-AI-Diffusion-Report-2026-Q1.pdf1,784,281 bytes
- reports/Microsoft-AI-Diffusion-Report-2026-Q2.pdf1,648,467 bytes
- reports/Microsoft-US-AI-Diffusion-Report-2026-Q1.pdf2,970,809 bytes
Microsoft research and original data: Microsoft AI Economy Institute. HTML views, calculated differences and visual presentation: in/out. Other contributing sources retain their own attribution and reuse terms.
Read the denominators
Methods, caveats and attribution.
Population use, firm adoption, employee experience and student use describe different things. Keep the source, question, population and observation window attached to every number.
Thirteen source groups: coverage, limits and reuse
Know what each number can carry.
Publication date is not observation date. Open the extracts for exact values, question bases, page references and source limitations.
| Source | Published | Observed | Population / coverage | Interpretation limit |
|---|---|---|---|---|
| Microsoft AI Economy Institute | 2025–2026 report series | H1 2025–Q2 2026; US Q1 2026 | 147 economies; 50 states + DC, 35 metros, 3,143 counties | Adjusted population telemetry and modeled local estimates. Usage is not proficiency or productivity. |
| Anthropic | 26 June 2026 | Geography: May 2026; output analysis: 10 Apr–10 Jun 2026 | Claude chat and Cowork; country publication thresholds apply | Provider-specific conversations; classifier-inferred purpose. The per-capita index is not a user percentage. |
| European Commission JRC / Eurostat | JRC: 14 October 2026 | 2021–2025; Eurostat snapshot updated 15 June 2026 | EU27; eligible enterprises with 10+ persons employed | Broad AI, not only GenAI. Strategic-sector coverage varies; the country map uses the broader enterprise series. |
| McKinsey | 25 August 2026 | 4 May–8 June 2026 | 1,719 respondents across 97 countries | Self-reports, GDP weighting, non-census sample. Reported financial effects are not causal estimates. |
| Gallup / JFF / Families & Workers Fund | 6 October 2026 | 26 January–24 March 2026 | 15,482 US employees; AI-effect questions: 7,845 AI users | Employee assessments; frequency and benefit questions have different bases. Job quality association is not causation. |
| HEPI / Kortext | 12 March 2026 | December 2025 for the 2026 edition | 1,054 full-time UK undergraduates | Weighted self-report survey. Earlier waves differ; 2026 adds wellbeing uses. Tool provision is student-reported. |
| National Literacy Trust | 18 August 2026 | Early 2026; pupils and teachers January–March | 40,543 pupils aged 13–18; 2,567 teachers; 3,073 parents | School recruitment; pupil sample largely England. Questions use different routed bases; findings are not national prevalence estimates. |
| Dartmouth College | 30 October 2026 · working paper | 10–23 September 2026 | 1,003 US four-year college students; College Pulse weighted online panel | Separate, overlapping agreement measures, not complements or an adoption rate. Weighted online-panel self-reports; working paper, peer review not verified. Design effects were not verified. No causal learning outcomes or direct comparison with HEPI. Table 12, PDF p. 22. |
| UK Government · AI Adoption Survey | 29 October 2026 | 7 January–21 April 2026 | UK private-sector businesses with at least five employees in SIC A–N and R–S. 3,503 telephone interviews with technology-responsible respondents; Market Location commercial sampling frame; weighted by business size and sector; 5% response rate. | Broad AI, including pilots, not only generative AI. Selected sectors and a five-employee threshold differ from Eurostat; no direct UK–EU ranking. Self-reports, not a census or causal productivity evidence. Low response creates nonresponse risk; weighting does not establish its absence. The report compares 32% with 16% in the prior wave. These are repeated cross-sections, not a panel; questionnaire and achieved samples changed. Tables 27 and 61. |
| Reuters Institute / Oxford | 29 October 2026 | 2025 and 2026 waves; 2026: 14 August–28 September | Six-country weekly use; nine-country search exposure. YouGov online questionnaire; nonprobability samples with quotas and weighting for age, gender, region, education and political leaning. Combined-respondent estimates use YouGov weights, not an unweighted average of country percentages. | Self-reported use and exposure, subject to recall and interpretation; online samples underrepresent people offline. No conventional sampling margin of error; not a worldwide estimate or directly comparable with Microsoft usage estimates. Different country sets and questions mean the weekly-use and search-exposure figures must not be subtracted as an exposure gap. Weekly-use comparison covers the same six countries, not a longitudinal panel. The prompted standalone-tool list changed from 13 tools in 2025 to 14 in 2026; this qualification accompanies the trend. |
Comparisons are source-aware
No pooled adoption score is calculated. Percentages retain their population, question and time window; percentage-point changes use comparable published endpoints where available. Missing evidence is never treated as zero.
Reported effects are not causal effects
Speed, quality, profit and support figures are respondent assessments unless explicitly described otherwise. These studies cannot jointly establish that AI caused a country’s growth, changed learning outcomes or improved job quality.
Small multiples, quiet scales
Charts favour direct labels, shared scales within a comparison and restrained reference lines. Static SVG maps and charts remain in the initial HTML. Tables and downloads provide every plotted value without requiring interaction.
Geography has limits
World reach does not make every study global. US workforce and UK education evidence remain local lenses. Natural Earth borders are cartographic references; US state geometry derives from Census boundaries.
Attribution and reuse by source
- Microsoft AI Economy Institute. Microsoft source collection uses MIT; attribution retained.
- Anthropic. June dataset documentation specifies CC-BY without a version; attribution retained. Report linked at source.
- European Commission JRC / Eurostat. JRC report CC BY 4.0; Eurostat source and reuse terms linked.
- McKinsey. Facts transcribed and charts redrawn; original report remains with publisher.
- Gallup / JFF / Families & Workers Fund. Facts transcribed and charts redrawn; original remains with publisher.
- HEPI / Kortext. Report supplied for this analysis; publisher PDF and data remain at source.
- National Literacy Trust. Facts transcribed and charts redrawn; original reports remain with publisher.
Natural Earth: public domain; US Atlas: Census-derived geometry, ISC package licence. No single licence is asserted over all contributing sources.
Excluded or uncertain comparisons
HEPI’s internally inconsistent encouragement percentage is omitted. National Literacy Trust frequency results with an unclear routed base are not presented as a share of all pupils; conflicting prior-year teacher-training figures are omitted. Eurostat time-series breaks and the expanded 2025 AI category remain in the downloadable data. No values are inferred from chart heights or unreported geographies.
Reuse documentation: Anthropic Economic Index data documentation · US Atlas original licence.
Microsoft methods, 17 transcription caveats and original-file fingerprints
The Microsoft collection: definitions and provenance.
What diffusion measures
The global reports define AI diffusion as the share of people aged 15–64 who used a generative AI product in the reported period. Aggregated Microsoft telemetry is adjusted for operating system and device share, internet penetration, and population. Usage does not measure capability, productivity, or economic impact.
How comparisons are made
Country changes subtract published rounded percentages. A rise from 10% to 12% is +2 percentage points. Periods are labeled categories; half-year and quarterly windows have different durations. No global or national user rate is calculated by averaging local percentages.
U.S. estimates have a distinct method
County figures are spatial small-area estimates, designed to address small samples, IP-geolocation noise, and infrastructure differences. State and metro aggregates use working-age population weights. The supplied CSVs contain no uncertainty intervals or population weights; none are fabricated here.
Design and completeness
Inspired by Edward Tufte’s principles: direct labels, common scales, quiet reference lines, small multiples, and data beside its explanation. All 3,376 CSV records and 3,817 rate observations are retained. Additional exact report data is transcribed; all 94 original pages cover the remaining graphical and narrative evidence.
Source inconsistencies and editorial decisions
The main country table follows AI_Diffusion_Q22026_Update.csv. The Q2 report appendix revises four Q1 2026 values upward by 0.1 percentage points: Algeria 13.2 → 13.3; Gambia 11.4 → 11.5; Ukraine 9.4 → 9.5; Cambodia 5.7 → 5.8. Q2 values agree. Each report snapshot is retained separately.
One economy name has a malformed byte in the CSV (T\x9frkiye). The main display uses “Turkey,” matching the PDF spelling. Original file bytes and source cell values remain intact in the original source downloads.
The H2 2025 report shows different UAE change labels: 4.6 pp in one chart and 4.50% in its appendix. Calculated changes in the main view always subtract the supplied rounded endpoints. Other printed changes may differ because of rounding.
The H1 2025 data-center capacity table totals 122.5 GW. Its U.S. and China entries total 85.6 GW (69.9%), while the accompanying prose states 86%. The original table and prose are both preserved; the capacity comparison uses the table values.
The U.S. PDF ranks 50 states, while the CSV contains 50 states plus the District of Columbia. The main table follows all 51 CSV entries. The 35 metros in the report have working-age populations above 1.5 million. Published top-county tables apply a minimum population of 10,000; the complete county CSV does not apply that display filter.
Report transcriptions preserve stated approximations, differing definitions, and source dates in their notes. Point-level values are not inferred from unlabeled curves or map colors. Full original pages provide coverage for those figures and all other narrative data.
Edition-specific transcription notes
The H1 PDF is image-only. Exact tables and key labels were visually read from rendered pages; OCR text is provided for navigation and may contain errors.
The 2025 H2 original appendix is an earlier vintage. Later CSV/report revisions should remain separate instead of being overwritten with these numbers.
H2 appendix changes are printed with % signs although differences are percentage points; several differ by 0.1 pp from subtraction of rounded endpoints.
H2 UAE change is 4.6 pp on page 4 but 4.50% on pages 6/14. Page 4 additionally differs from appendix for Switzerland (2.4 vs 2.5), Sweden (2.1 vs 2.2), Austria (2.3 vs 2.2), United States (2.0 vs 2.1).
H1 page 17 tabulated capacities sum to 122.5 GW; US+China total 85.6 GW = 69.9% of that sum. Pages 3/18 claim 86%. Original values preserved without resolving the inconsistency.
H2 page 7 user-base-growth chart says H1 to H2 2025 but prose says since October 2024. Treat 81.4% as printed with period ambiguous.
H2 page 8 benchmark chart carries an unrelated Global North/South chart title; English/Korean labels and adjacent text establish the intended measure.
Original PDFs mix population and working-age-population descriptions of diffusion. Retain the report-vintage methodology caveat; do not interpret user-share numbers as general-population counts.
Country PDFs use Turkey, while CSV apparently has corrupted encoding for Türkiye. Normalize entity identity without claiming the CSV spelling was valid.
Q2 report appendix revises prior Q1 values: Algeria 13.3 (previous 13.2); Gambia 11.5 (previous 11.4); Ukraine 9.5 (previous 9.4); Cambodia 5.8 (previous 5.7). Keep vintages visible.
Q1 Japan narrative claims3.4 pp increase is more than3 times global increase, but global table says1.5 pp. Preserve values, do not repeat claim.
Q1 agentic pull-request chart startsMay 2025; prose saysJune 2025.
Q2 Hugging Face figure dates first report Oct 2025 and endpoint Aug 2026; prose uses Nov 2025 and Sep 2026.
Q2 includes model/activity evidence through September 2026 although adoption snapshot is June 2026.
Global denominator explicitly ages 15–64. US report refers to working-age population; README describes distinct Bayesian spatial small-area estimates and working-age aggregation. The two methods should not be treated as identical.
US population and job-mix associations are not causal estimates.
Exact labeled numerical data were transcribed/extracted. Unlabeled graphics are retained through source-page images rather than estimated.
Reproducibility and original-file fingerprints
This page preserves the 2025–2026 source collection accompanying Microsoft’s AI Diffusion research. Filters and derived changes run locally in your browser. Source downloads reproduce the original bytes. CSV exports from filtered views are derived convenience files. SHA-256 fingerprints identify each original file.
| Original file | SHA-256 |
|---|---|
| LICENSE.md | 2dc1bdc83678f2c0fa39d1b8a6c4e143877cffe07789ce9135189b0a282e224f |
| README.md | 586827c455a8d5813c89ab8581c200d392b2b444c3f272dd86f31c270a3dc128 |
| SECURITY.md | b02bf4e236e9335b27298a77688c751d18ca7e6052873d0d3d29eda37d0a72fa |
| data/AI_Diffusion_Q22026_Update.csv | 4a076d6aded6d8c9e60ddfff8a28476a72bb94e5293ae8feaa40c6bda06bd92a |
| data/US/County_AI_User_Share_2026Q1.csv | 5dc2355ef4c7b17af940710c959c6a78ff8f59ac55ff8541161c5ca53a5bf351 |
| data/US/MSA_Ranking_2026Q1.csv | 4ea3d0afecbde178bfe5bce23995e8bc85a1479a0afc4c9e2fe9704b1e7c5d50 |
| data/US/State_Rankings_2026Q1.csv | 6b79be96c85862e616bcce24b9262c8835046b7e1ef8e1986ddd3b26e2dd1ebe |
| reports/Microsoft-AI-Diffusion-Report-2025-H1.pdf | a1220d061a69362b21f0767b7ef853594d64a6e7933fbd0a0ea2eee042246070 |
| reports/Microsoft-AI-Diffusion-Report-2025-H2.pdf | 4f841408823012e8052143b83968b155d4f5acdb61017cf57412a7b13e50b267 |
| reports/Microsoft-AI-Diffusion-Report-2026-Q1.pdf | 3bf9f87b633724128c8389dc0701c0f4e03c943730e4bec5b04878368b655782 |
| reports/Microsoft-AI-Diffusion-Report-2026-Q2.pdf | d9397e9ae9cced6d589ea9616ea34a7ad5d80744bd6d00f728914ca3577a9209 |
| reports/Microsoft-US-AI-Diffusion-Report-2026-Q1.pdf | 084326ae828956d03ff0a5d3d7082582d1563bc38bb36d499eabb4e2d1b4fd89 |
Microsoft collection: attribution and MIT Licence
Research and source data © 2026 Microsoft, produced by the Microsoft AI Economy Institute (AIEI). Source: microsoft/ai-diffusion-report. Repository materials are provided under the MIT Licence. The original notice is reproduced below. This visual presentation was prepared for in/out.
MIT License

Copyright (c) [2026] [Microsoft]

Permission is hereby granted, free of charge, to any person obtaining a copy of this software and associated documentation files (the "Software"), to deal in the Software without restriction, including without limitation the rights to use, copy, modify, merge, publish, distribute, sublicense, and/or sell copies of the Software, and to permit persons to whom the Software is furnished to do so, subject to the following conditions:

The above copyright notice and this permission notice shall be included in all copies or substantial portions of the Software.

THE SOFTWARE IS PROVIDED "AS IS", WITHOUT WARRANTY OF ANY KIND, EXPRESS OR IMPLIED, INCLUDING BUT NOT LIMITED TO THE WARRANTIES OF MERCHANTABILITY, FITNESS FOR A PARTICULAR PURPOSE AND NONINFRINGEMENT. IN NO EVENT SHALL THE AUTHORS OR COPYRIGHT HOLDERS BE LIABLE FOR ANY CLAIM, DAMAGES OR OTHER LIABILITY, WHETHER IN AN ACTION OF CONTRACT, TORT OR OTHERWISE, ARISING FROM, OUT OF OR IN CONNECTION WITH THE SOFTWARE OR THE USE OR OTHER DEALINGS IN THE SOFTWARE.
Integrated analysis and visualisation by Alessandro L. Piana Bianco for in/out. Research remains attributed to its respective creators. No single licence is asserted over all contributing sources.
Menlo: spending intensity, separately measured
Two supplementary survey observations: average 4.7× and median 2.2× reported spending growth. Fieldwork 8–26 September; published 3 November 2026. Not pooled with adoption measures.
Primary source ↗ · Report PDF ↗ · CSV · Data and provenance · JSON · Methods · Chart and exact values
Reuters: acceptance of AI-produced news
Very or somewhat comfortable; four separate scenarios, not parts of a total. Nine-country weighted online sample, n=18,921; YouGov fieldwork 14 August–28 September 2026, published 29 October. This base differs from the six-country use trend; the figures are not a worldwide estimate. This extends the existing Reuters source, not an independent study.
Primary report · section 4 ↗ · Four observations · CSV · Data and provenance · JSON · Methods · Chart and exact values
Stanford AI100 · Infrastructure and agency
Published November 2026; expert synthesis of developments from 2021–2026. The infrastructure discussion (pp. 98–105) covers interdependent models, data, networks, chips and data centres, and the consequences of concentrated capacity for sovereignty and agency.
Contextual synthesis, not a population survey, adoption rate or causal estimate. Access to an AI model does not establish the capacity to operate, adapt or govern it. No new quantitative ledger observations are drawn from this source.
Primary source ↗ · Methods and qualifications · Context and provenance · JSON
McKinsey Global Institute · AI fluency in job requirements
Agents, robots, and us: Skill partnerships in the age of AI, November 2025. Exhibit 7 combines Lightcast job-posting analysis and US Bureau of Labor Statistics employment: occupations where AI fluency appeared in at least 5% of postings employed about 1.0 million workers in 2023 and 7.0 million in 2025. The report identifies May 2025 postings in its methods.
Employees in occupations crossing a posting threshold, not AI users, people with AI skills, vacancies or new jobs. The rounded values are retained; no causal productivity or employment outcome is inferred. This is older supporting evidence, not a November 2026 release. Automation-potential and economic-value scenarios are not measured outcomes.
Primary source ↗ · Methods and qualifications · Context and provenance · JSON
Dubai Future Foundation · AI in creative industries
Guidelines for the development, regulation, and use of artificial intelligence in creative industries (2024). Research ran from October 2023 to September 2024: two virtual and four in-person participatory-design workshops with 67 participants, expert interviews, and small-scale surveys and opinion polls. The report addresses authorship, compensation and cultural representation.
Qualitative expert consultation, explicitly not for statistical analysis. Senior experts were selected and participation expanded through snowball sampling; this is not a representative survey of creative workers, industries or Dubai. Used for governance context, with no quantitative adoption observations.
Primary source ↗ · Methods and qualifications · Context and provenance · JSON
Kyndryl · deployment and organisational redesign
Three separate leadership-survey observations, fielded 10 July–2 September 2026. Agreement thresholds differ; not a national adoption estimate or an integration-gap calculation.
Data
| Statement | Share | Response threshold | Source |
|---|---|---|---|
| AI deployed beyond pilot projects | 84% | Agree | Q8; p.9 |
| Roles formally redesigned or reorganised around AI | 27% | Completely agree | Q6; p.25 |
| Formal AI change-management programmes fully implemented | 29% | Completely agree | Q6; p.25 |