Explore the evidence / Work & learning
What changes for people?
Worker experiences, Australian recruitment and productivity reports, student use and provision, and the support teachers and pupils receive.
Find a chart, dataset, or source
- Acceptance of AI-produced newsWorld geography · nine-country attitudes
- Enterprise spending intensityOrganisations · supplementary survey
- Australia: perceived recruitment effectsWork · ABS reported vacancy effects
- Australia: productivity gains in liaisonWork · RBA approximate context
- OECD technology co-useOrganisations · 28 countries and published mean
- US business and employee-use reportsOrganisations · two separate business measures
- Reuters Institute: weekly use and search exposureAccess & geography · separate survey measures
- UK business AI use and skills barriersOrganisations · separate UK survey
- One world. Two different measures.World geography
- How many people use generative AI?World geography
- Where is Claude used disproportionately?World geography
- Read one place across the evidence.World geography
- United Arab EmiratesWorld geography
- Use rises. The gaps remain.World geography
- Adoption rises; the North–South gap widens.World geography
- All 147 economies move upward.World geography
- The ten largest gainsWorld geography
- All four periods, side by side.World geography
- Population reachWorld geography
- National averages conceal local variation.United States
- Every county counts once.United States
- From states to individual counties.United States
- Adoption differs across European economies.Organisations
- Where European firms have adopted AIOrganisations
- Read sector growth with its coverage.Organisations
- Sector growth needs a coverage lensOrganisations
- Size, scaling and returns answer different questions.Organisations
- Larger firms pull ahead with agentsOrganisations
- Personal gains and organisational returnsOrganisations
- Deployment expanded across functions.Organisations
- Use differs by education and role.Work & learning
- Use across the workforceWork & learning
- Access differs by education and roleWork & learning
- Faster work is one outcome among several.Work & learning
- What AI users reportWork & learning
- Widespread use meets uneven provision.Work & learning
- Students use more than institutions provide.Work & learning
- A gap between teacher use and training.Work & learning
- Adoption does not establish critical use.Work & learning
- Critical use is uneven within adoption.Work & learning
- What adoption leaves unresolved.Work & learning
- Conversations extend beyond paid work.AI tasks
- Purpose of Claude conversationsAI tasks
- Answers, documents and guidance are common outputs.AI tasks
- Three common outputsAI tasks
- The same output can serve different purposes.AI tasks
- The same output, different purposesAI tasks
- Behind the headline numbers.Evidence library
- Microsoft research in brief.Evidence library
- Five reports. Every page.Evidence library
- Global · H1 2025Evidence library
- Global · H2 2025Evidence library
- Global · Q1 2026Evidence library
- Global · Q2 2026Evidence library
- United States · Q1 2026Evidence library
- Data, reports and source files.Evidence library
- Microsoft geographic dataEvidence library
- Survey, sector and geographic evidenceEvidence library
- Five original reportsEvidence library
- Transcriptions and provenanceEvidence library
- Methods, caveats and attribution.Evidence library
- Know what each number can carry.Evidence library
- The Microsoft collection: definitions and provenance.Evidence library
- All datasets and downloads · CSV, JSON, PDF and textEvidence library
- Read all 94 original report pagesEvidence library
- Search 65 transcribed tables and recordsEvidence library
- Complete methods, caveats, provenance and licencesEvidence library
- 147 economies · four-period table and country searchWorld geography
- US states, metros and all 3,143 counties · search, filter, exportUnited States
- Science · eight research tasks, two interfacesAI tasks · session shares
No matching views. Try a broader topic, or browse the six areas above.
Each chart keeps its own population and observation period. Wide charts can be scrolled horizontally; open the values beneath any chart for the underlying observations.
01 / Who uses AI at work
Use differs by education and role.
Gallup reports weekly or daily AI use among 28% of US employees; 54% had never used AI in their role. These are selected frequency categories. The education and role comparisons use separate subgroup bases.
Use across the workforce
US employees; 0–100%.
Exact values and populations
| Measure / group | Share | Observation period | Population |
|---|---|---|---|
| Weekly or daily AI use | 28% | Jan–Mar2026 | All surveyed US employees; full sample n=15,482 |
| Never used AI in their role | 54% | Jan–Mar2026 | All surveyed US employees; full sample n=15,482 |
Access differs by education and role
Share using AI weekly or daily; separate subgroup comparisons.
Exact values and populations
| Measure / group | Share | Observation period | Population |
|---|---|---|---|
| College graduates | 40% | Jan–Mar2026 | US employees with a college degree |
| Without a college degree | 17% | Jan–Mar2026 | US employees without a college degree |
| Managers | 37% | Jan–Mar2026 | US employees in management roles |
| Individual contributors | 25% | Jan–Mar2026 | US employees in individual-contributor roles |
02 / Benefits and demands
Faster work is one outcome among several.
Among employees using AI at least a few times in the previous year, 63% report working faster and 31% report being asked to take on more responsibility. Benefits and demands can coexist; responses overlap.
What AI users report
Employees using AI at least a few times in the past year; 0–100%.
Exact values and populations
| Measure / group | Share | Observation period | Population |
|---|---|---|---|
| Work faster | 63% | Jan–Mar2026 | AI-using employees; at least a few times in prior year; n=7,845 |
| Find more creative solutions | 56% | Jan–Mar2026 | AI-using employees; at least a few times in prior year; n=7,845 |
| More time for interesting work | 47% | Jan–Mar2026 | AI-using employees; at least a few times in prior year; n=7,845 |
| Produce higher-quality work | 46% | Jan–Mar2026 | AI-using employees; at least a few times in prior year; n=7,845 |
| Employer asks for more responsibility | 31% | Jan–Mar2026 | AI-using employees; at least a few times in prior year; n=7,845 |
Gallup / American Job Quality Study, 6 October 2026. Fieldwork: 26 January–24 March 2026. Full employee sample: 15,482; AI-user effects sample: 7,845. Self-assessments do not establish causal productivity gains.
Australia / Recruitment effects
What do businesses report about vacancies?
ABS Job Vacancies Survey · reference date 21 August 2026 · AI results added 4 November.
Share of responding businesses with at least five employees reporting each perceived effect of AI on their level of vacancies. These are business shares, not shares of jobs or vacancies.
Source: ABS, August 2026 release. Final survey weights; no nonresponse adjustment.
Source discrepancy: these four published shares sum to 99.2%, not 100%. Both the release and workbook repeat them without explaining the 0.8-point gap. Values are preserved as published; the bars are not normalized and no residual category is inferred.
Read the values and definitions
| Reported effect | Share of businesses |
|---|---|
| No impact on vacancies | 81.8% |
| Fewer vacancies | 3.8% |
| More vacancies | 0.6% |
| Unsure of impact | 13.0% |
Firms with fewer than five employees and businesses that did not answer the AI item are excluded. The absence of a nonresponse adjustment may affect representativeness. The reference day follows the methodology’s third-Friday rule. Vacancy levels are a stock, not a measure of hires over the quarter.
Self-reported attribution does not establish causation. These figures are neither an AI adoption rate nor a job-loss rate. No causal productivity or employment result is inferred.
Four observations · CSV · Data and provenance · JSON · Methods and source workbook →
Australia / Liaison context
Use does not guarantee a productivity gain.
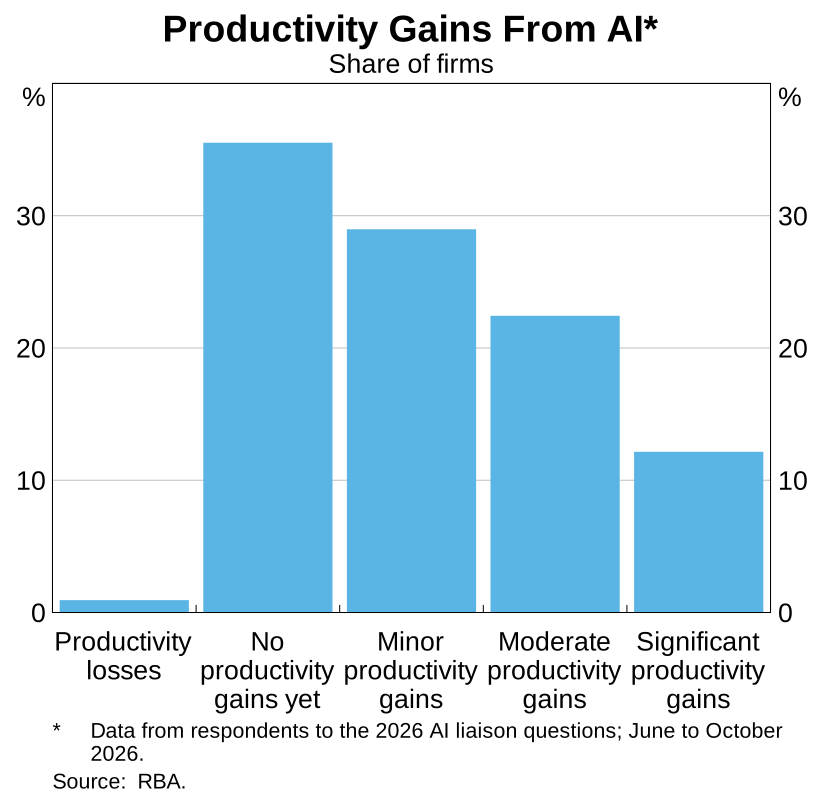
Around 35% of firms responding to the RBA’s 2026 AI liaison questions reported no productivity gains yet. Graph 2 in Sarah Hunter’s 9 November speech covers responses from June–October 2026.
This is the RBA’s approximate description, retained as context rather than an exact chart observation. Liaison respondents are not a representative national firm survey; the program mainly covers medium and larger firms. Firm-reported effects do not establish causation or measure aggregate productivity.
Graph 1’s year comparison uses different samples and questions, as well as May–August 2025 versus June–October 2026 windows. No like-for-like annual adoption change is calculated here, and these responses are not pooled with ABS or other surveys.
Speech ↗ · Graph 2 and notes ↗ · Methods → · Context and provenance · JSON
03 / The support around learning
Widespread use meets uneven provision.
These are separate surveys of UK undergraduates and AI-aware teachers. Student-reported access to institutional tools and teacher-reported school training are distinct forms of support, with different populations and questions.
Students use more than institutions provide.
Share of surveyed UK full-time undergraduates; annual survey editions.
Read the values and definitions
| Measure | Edition | Share | Denominator | Source |
|---|---|---|---|---|
| Used AI for at least one purpose | 2024 | 66% | Full-time UK undergraduates | p. 10 |
| Used AI for at least one purpose | 2025 | 92% | Full-time UK undergraduates | p. 10 |
| Used AI for at least one purpose | 2026 | 95% | Full-time UK undergraduates | p. 10 |
| Said institution provides generative AI tools | 2024 | 9% | Full-time UK undergraduates | p. 35 |
| Said institution provides generative AI tools | 2025 | 23% | Full-time UK undergraduates | p. 35 |
| Said institution provides generative AI tools | 2026 | 38% | Full-time UK undergraduates | p. 35 |
A gap between teacher use and training.
NLT teachers who had heard of generative AI. Independent questions.
Read the values and definitions
| Measure | Edition | Share | Denominator | Source |
|---|---|---|---|---|
| Had used generative AI | 2025 | 58% | Surveyed teachers who had heard of generative AI | p. 6 |
| Had used generative AI | 2026 | 80.6% | Surveyed teachers who had heard of generative AI | p. 6 |
| Received AI training or support through school | 2026 | 32.6% | Surveyed teachers who had heard of generative AI | p. 19 |
US college students · new evidence
Guidance and self-directed learning can coexist.
In Dartmouth’s weighted US college sample, 79.3% say they mostly developed their AI skills independently and 68.1% report meaningful guidance from professors and courses. These answers can overlap. Only 49.5% say their institution adequately prepares them for future career AI use.
| Statement | Share | Item sample |
|---|---|---|
| Mostly developed AI skills independently, outside formal coursework | 79.3% | 1,003 |
| Professors and courses provided meaningful guidance on effective and ethical AI use | 68.1% | 1,003 |
| Institution adequately prepares students for AI use in their future career | 49.5% | 1,003 |
College Pulse weighted online panel of students at US four-year colleges and universities, 10–23 September 2026. Separate, overlapping agreement measures, not complements or an adoption rate. Weighted online-panel self-reports; working paper, peer review not verified. Design effects were not verified. No causal learning outcomes or direct comparison with HEPI. Working paper, Table 12 (PDF p. 22) · Source and methods.
04 / Judgement and learning
Adoption does not establish critical use.
Among AI-using pupils, 52.3% said they checked outputs for accuracy and 24.1% said they usually copied AI output for homework. These behaviours do not measure causal learning gains; subgroup differences remain associations.
Critical use is uneven within adoption.
Share agreeing with each behaviour among surveyed pupils who use AI.
Read the values and definitions
| Measure | Edition | Share | Denominator | Source |
|---|---|---|---|---|
| Add own thoughts to AI outputs | 2026 | 56.5% | Surveyed 13–18-year-olds who use AI | p. 12 |
| Check AI outputs for accuracy | 2026 | 52.3% | Surveyed 13–18-year-olds who use AI | p. 12 |
| Usually copy AI output when using it for homework | 2026 | 24.1% | Surveyed 13–18-year-olds who use AI | p. 12 |
| Usually copy AI output for homework: FSM | 2026 | 31.6% | AI-using surveyed 13–18-year-olds in the FSM subgroup | p. 13 |
| Usually copy AI output for homework: Non-FSM | 2026 | 22.4% | AI-using surveyed 13–18-year-olds in the Non-FSM subgroup | p. 13 |
What adoption leaves unresolved.
In HEPI’s survey, 94% used AI to help with assessed work, a broader category than submitting AI-written text. While 68% saw AI skills as essential, 48% felt teaching staff helped develop them for future careers. HEPI, pp. 14 and 30–31 ↗
The NLT parent survey adds the home: 67.8% reported using AI together as a family and 62.5% wanted children to learn about AI at school. These figures are from the publisher’s summary; exact fieldwork dates are not specified there. Parent findings ↗
School evidence: NLT’s early-2026 pupil survey covered 40,543 respondents aged 13–18, 92.7% in England. Schools were recruited through its networks; results are not a national probability sample. HEPI is a weighted undergraduate survey. Neither measures causal learning gains. All figures retain their own denominators.